VMR Market Regime - Market Breadth Chart & Analysis
Deep-dive technical analysis of the underlying structural health of the broad equity markets.
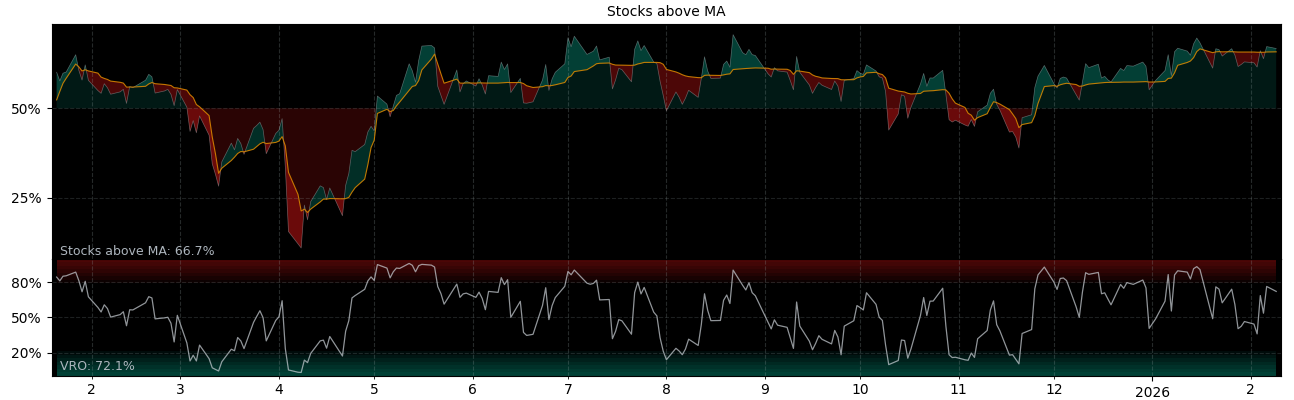
Stocks above MA within S&P 500
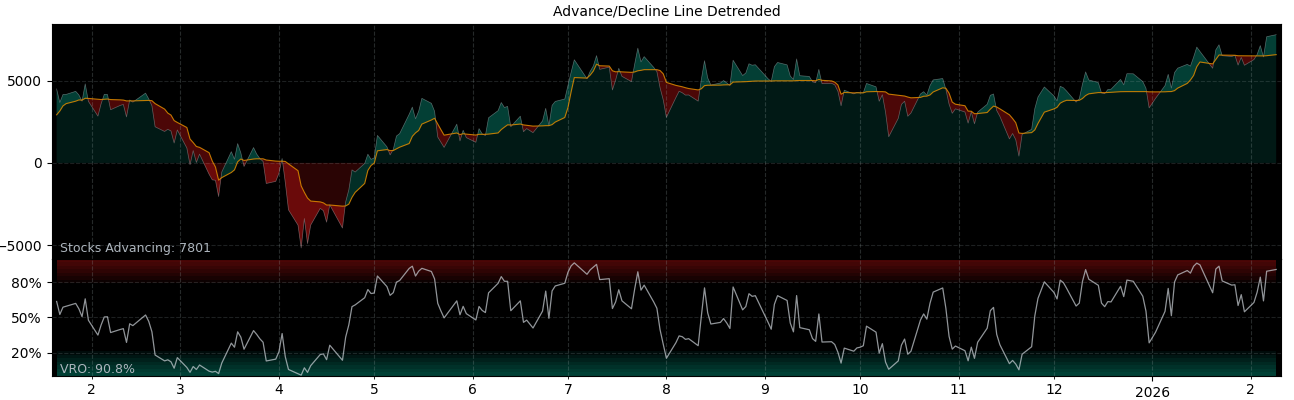
Advance Decline Line ADL all NYSE, Detrended
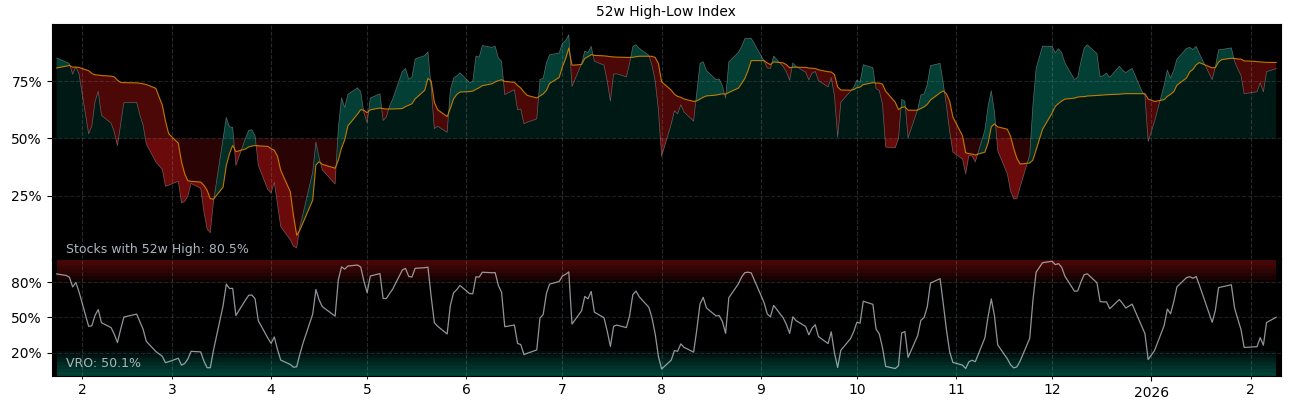
52 Week High Low all NYSE
API Endpoints
- Market Regime Data — aggregated regime scores, trends and sub-indicators
- Symbol Data (SPY) — technicals, performance and signal strength for S&P 500
Recommended Options Strategies based on VMR
Long Puts
High expectation for IV to increase: Buy with low Premium and sell on higher Premium, while the stocks are going down.
Short Iron Condor
Moderate expectation for IV to decrease. Sell when 50%–80% of the Premium is collected, or when the stock price approaches the short strikes.
Do Nothing
Sometimes it's better to stay out of the market, just wait for a better opportunity.
Bull Put Spread
Good expectation for IV to decrease: Collect Premiums now and buy them back when the Premium drops, while the stock is going up.
Before you buy, answer the following questions
- What is the current overall Market Regime?
- Does this stock have a sector-specific tail- or headwind?
- Is this stock the best in its Peer-Group?
- Why should other Investors buy and hold this stock?
- At what prices would Bagholders sell?
Other recommended sources to identify the Market Regime
- Is the AAII Investor Sentiment Survey above or below Historical Average?
- Is the VIX above or below 21, is the VIX Term Structure in Contango or Backwardation?
- Will the FED increase, hold or decrease the Interest Rate?
About the Market Regime Indicator
The Market Regime measures the overall health and direction of a financial market by examining the number of individual assets participating in a particular market move. It is a quantitative assessment that helps investors gauge the underlying strength or weakness of a market trend.
We developed a contrarian market regime indicator, based on seven different momentum indices, a sophisticated approach to assess market sentiment. Our contrarian indicator looks for divergences between market sentiments and price movements.
Symbols used in this Market Regime Indicator
We use the following symbols to calculate the Market Regime Indicator, which is a weighted average of the individual indicators. The Nasdaq versions are not used in the calculation, but can be used as alternatives.
| Symbol | Description | Alternatives |
|---|---|---|
| S5TW | Percent of Stocks Above 20-Day Average S&P 500 | MMTW for Overall / NDTW for Nasdaq |
| S5FI | Percent of Stocks Above 50-Day Average S&P 500 | MMFI for Overall / NDFI for Nasdaq |
| S5TH | Percent of Stocks Above 200-Day Average S&P 500 | MMTH for Overall / NDTH for Nasdaq |
| MALN | 52 Weeks Lows NYSE | MALQ for Nasdaq |
| MAHN | 52 Weeks High NYSE | MAHQ for Nasdaq |
| ADVN (or NSHU) | Advancing Stocks NYSE | ADVQ for Nasdaq |
| DECN (or NSHD) | Declining Stocks NYSE | DECQ for Nasdaq |