(EPOW) Sunrise New Energy Co. - Performance 2.1% in 12m
Compare EPOW with Indices, Sectors and Commodities and Bonds. Who performs better in which timeframe?
Performance Rating
-53.18%
#165 in Group
Rel. Strength
64.45%
#2786 in Universe
Total Return 12m
2.09%
#42 in Group
Total Return 5y
-83.46%
#183 in Group
P/E -
(?) Percentile in Group
P/E Forward -
(?) Percentile in Group
PEG -
(?) Percentile in Group
FCF Yield -47.00%
9th Percentile in Group
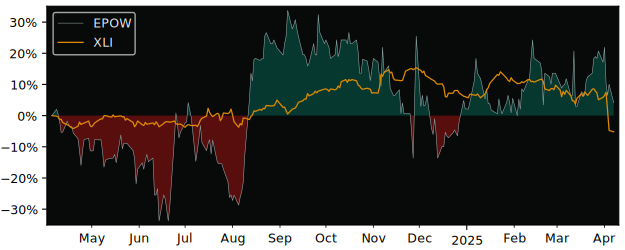
12m Total Return: EPOW (2.1%) vs XLI (-5%)
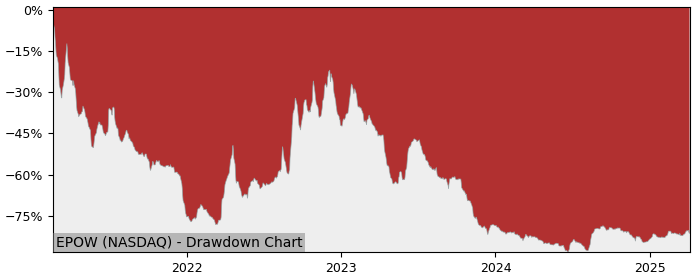
5y Drawdown (Underwater) Chart
Top Performers in Industrial Machinery & Supplies & Components
Overall best picks of Peer Group Selected by proven GARP Predictive Metrics, sorted by Growth Rating
| Symbol | 1m | 12m | 5y | P/E | P/E Forward | PEG | EPS Stability |
EPS CAGR |
|---|---|---|---|---|---|---|---|---|
| NPO NYSE Enpro Industries |
-19.7% | -14% | 248% | 41 | 19.3 | 1.74 | -47.6% | -6.67% |
| MWA NYSE Mueller Water Products |
-8.86% | 48.3% | 164% | 29.3 | 21.1 | 1.41 | 28.3% | 14.1% |
| G1A XETRA GEA |
-14.6% | 32.4% | 161% | 23.8 | 19.5 | 1.99 | 63.9% | 13.3% |
| SXI NYSE Standex International |
-26.1% | -21% | 205% | 34.9 | 17.7 | 0.95 | 33.5% | -12.6% |
| SU PA Schneider Electric S.E. |
-16.7% | -9.73% | 159% | 28.5 | 22.3 | 1.93 | 76.3% | 37% |
| EPAC NYSE Enerpac Tool |
-15.5% | 9.24% | 127% | 24.5 | 22.1 | 0.34 | 86.1% | 8.64% |
| SPXC NYSE SPX |
-11.1% | 0.34% | 240% | 28.5 | 19.8 | 1.1 | 19.7% | 20.2% |
| PNR NYSE Pentair |
-12.3% | -5.95% | 154% | 23.4 | 18.3 | 1.52 | 44.1% | 6.41% |
Performance Comparison: EPOW vs XLI vs S&P 500
XLI (Industrial Sector SPDR ETF) is the Sector Benchmark for EPOW
| Total Return (including Dividends) | EPOW | XLI | S&P 500 |
|---|---|---|---|
| 1 Month | -6.88% | -12.29% | -12.16% |
| 3 Months | -12.00% | -11.00% | -14.06% |
| 12 Months | 2.09% | -5.03% | -1.53% |
| 5 Years | -83.46% | 100.81% | 94.99% |
| Trend Score (consistency of price movement) | EPOW | XLI | S&P 500 |
| 1 Month | 24.5% | -8.3% | -10.4% |
| 3 Months | 35.7% | -56.9% | -68.4% |
| 12 Months | 48.6% | 71.6% | 78.6% |
| 5 Years | -73.7% | 87.5% | 84.3% |
| Relative Strength (compared with Indexes) | Rank in Peer Group | vs. XLI | vs. S&P 500 |
| 1 Month | #33 | 6.17% | 6.01% |
| 3 Month | #74 | -1.13% | 2.39% |
| 12 Month | #42 | 7.50% | 3.67% |
| 5 Years | #180 | -88.1% | -88.0% |
FAQs
Does EPOW Sunrise New Energy Co. outperforms the market?
Yes,
over the last 12 months EPOW made 2.09%, while its related Sector, the Industrial Sector SPDR (XLI) made -5.03%.
Over the last 3 months EPOW made -12.00%, while XLI made -11.00%.
Over the last 3 months EPOW made -12.00%, while XLI made -11.00%.
Performance Comparison EPOW vs Indeces and Sectors
EPOW vs. Indices EPOW is Over or Underperforming
| Symbol | 1w | 1m | 6m | 12m | |
|---|---|---|---|---|---|
| US S&P 500 | SPY | -1.27% | 5.28% | -2.27% | 3.62% |
| US NASDAQ 100 | QQQ | -1.45% | 6.84% | -1.03% | 5.34% |
| US Dow Jones Industrial 30 | DIA | -1.50% | 4.32% | -4.02% | 2.96% |
| German DAX 40 | DAX | -0.44% | 7.03% | -16.4% | -5.47% |
| Shanghai Shenzhen CSI 300 | CSI 300 | 0.68% | 6.40% | 20.3% | 4.27% |
| Hongkong Hang Seng | HSI | -0.65% | 7.48% | 8.49% | -2.78% |
| India NIFTY 50 | INDA | -6.54% | -6.98% | -1.13% | 7.62% |
| Brasil Bovespa | EWZ | -3.75% | -3.37% | 1.37% | 22.5% |
EPOW vs. Sectors EPOW is Over or Underperforming
| Symbol | 1w | 1m | 6m | 12m | |
|---|---|---|---|---|---|
| Communication Services | XLC | -1.67% | 5.76% | -10.8% | -4.94% |
| Consumer Discretionary | XLY | -2.58% | 5.05% | -5.89% | 1.15% |
| Consumer Staples | XLP | -6.06% | -0.97% | -10.3% | -5.11% |
| Energy | XLE | 5.17% | 2.92% | 2.09% | 19.2% |
| Financial | XLF | 0.38% | 3.03% | -11.4% | -5.16% |
| Health Care | XLV | -3.20% | 2.69% | -2.69% | 6.38% |
| Industrial | XLI | -0.66% | 5.41% | -0.41% | 7.12% |
| Materials | XLB | -0.23% | 5.45% | 5.57% | 18.0% |
| Real Estate | XLRE | -1.95% | 3.03% | -2.39% | 0.46% |
| Technology | XLK | 0.05% | 9.02% | 4.85% | 12.5% |
| Utilities | XLU | -4.18% | -2.51% | -6.68% | -13.2% |
| Aerospace & Defense | XAR | -1.96% | 2.31% | -5.21% | -4.42% |
| Biotech | XBI | -1.10% | 9.51% | 11.4% | 21.2% |
| Homebuilder | XHB | -3.97% | 4.51% | 12.6% | 18.5% |
| Retail | XRT | -4.50% | 2.93% | 0.63% | 14.4% |