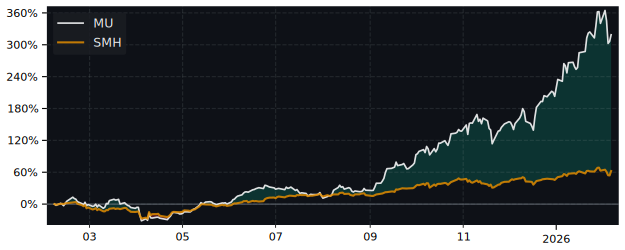
MU Performance: 522.1% Return (12 Months)
MU returned 522.1% over 12 months, outperforming the S&P 500 (37.7%). Volatility: 73.5%.
| P/E Trailing | 17.3 |
| P/E Forward | 6.33 |
| 52 Week High | 461.54 USD |
| 52 Week Low | 65.38 USD |
| VRO Trend Strength ±100 | 29.70 |
| Buy Signal ±3 | 0.94 |
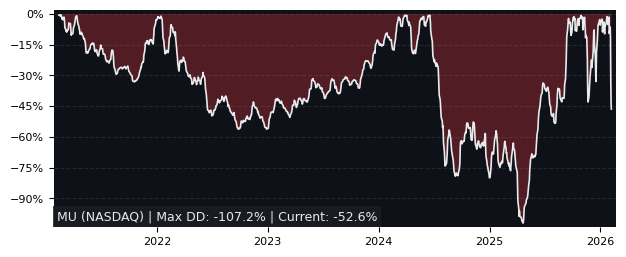
| Max Drawdown | 57.63% |
| Mean Drawdown | 16.49% |
Top Performer in Semiconductor Materials & Equipment (5/37)
| SYMBOL | 1W | 1M | 3M |
|---|---|---|---|
| AEHR | 59.49% | 54.50% | 178.24% |
| ICHR | 10.17% | 26.22% | 133.57% |
| UCTT | 8.11% | 29.77% | 110.84% |
| SOI | 2.15% | 29.81% | 108.38% |
| AIXA | 12.02% | 31.61% | 91.85% |
| MU | 10.57% | 4.52% | 24.43% |
| SYMBOL | 6M | 12M | 5Y |
|---|---|---|---|
| AEHR | 144.33% | 831.56% | 2610.73% |
| MU | 107.12% | 522.07% | 336.28% |
| TER | 148.07% | 429.16% | 180.22% |
| FORM | 208.46% | 408.20% | 135.36% |
| AEIS | 109.95% | 358.78% | 212.81% |
| AIXA | 172.85% | 289.21% | 110.00% |
| SYMBOL | MCAP | 1M | 12M | 5Y | P/E | P/E fwd | PEG | EPS stab | EPS cagr |
|---|---|---|---|---|---|---|---|---|---|
| AMAT NASDAQ Applied Materials |
277B | 13.8% | 202% | 198% | 35.7 | 32.6 | 1.69 | 87.5% | 6.95% |
| CAMT NASDAQ Camtek |
7.34B | 9.57% | 225% | 408% | 152 | 46.5 | 3.11 | 94.7% | 17.7% |
| LRCX NASDAQ Lam Research |
274B | 16.7% | 312% | 300% | 44.9 | 32.7 | 1.60 | -3.10% | -47.4% |
| MU NASDAQ Micron Technology |
413B | 4.52% | 522% | 336% | 17.3 | 6.33 | 0.21 | 62.1% | 51.2% |
| TER NASDAQ Teradyne |
50.2B | 20.9% | 429% | 180% | 92.6 | 52.4 | 1.74 | -5.20% | 17.6% |
Performance: MU vs S&P 500
| PERIOD | MU | S&P 500 |
|---|---|---|
| 1 Week | 10.57% | 3.17% |
| 1 Month | 4.52% | -0.06% |
| 3 Months | 24.43% | -1.69% |
| 6 Months | 107.12% | 1.00% |
| 12 Months | 522.07% | 37.72% |
| 5 Years | 336.28% | 75.84% |
MU Performance FAQ
Does MU outperform the market?
Yes, MU significantly outperforms the market. Over the past 12 months, MU returned 522.07% compared to 37.72% for the S&P 500.
What is the MU return over the last 12 months?
MU has returned 522.07% over the past 12 months, including dividends. Over 3 months the return was 24.43%, and over 5 years 336.28%.
How risky is MU?
MU has relatively low risk with a maximum drawdown of 57.63% over the past 3 years. The average drawdown is 16.49%.
MU vs Sectors (12m)
Sorted by outperformance. Positive = MU beats sector.
| SECTOR | ETF | DIFFERENCE 12M |
|---|---|---|
| Consumer Staples | XLP | 510.7% |
| Health Care | XLV | 507.5% |
| Financials | XLF | 503.7% |
| Real Estate | XLRE | 503.6% |
| Consumer Discretionary | XLY | 495.4% |
| Consumer Discretionary | XLY | 495.4% |
| Communication Services | XLC | 488.3% |
| Materials | XLB | 480% |
| Industrials | XLI | 473.7% |
| Energy | XLE | 465.3% |
| Technology | XLK | 463.5% |
MU vs Asset Classes (12m)
| ASSET CLASS | ETF | DIFFERENCE 12M |
|---|---|---|
| S&P 500 | SPY | 351.68% |
| Gold | GLD | 464.2% |
| Long-Term Bonds | TLT | 519.2% |