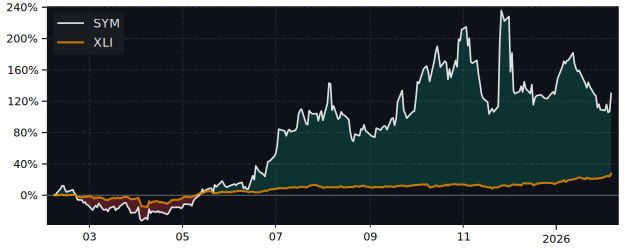
SYM Performance: 187.2% Return (12 Months)
SYM returned 187.2% over 12 months, outperforming the S&P 500 (32.1%). Volatility: 92.5%.
| P/E Trailing | 0.00 |
| P/E Forward | 156 |
| 52 Week High | 87.30 USD |
| 52 Week Low | 17.50 USD |
| VRO Trend Strength ±100 | 46.73 |
| Buy Signal ±3 | -1.13 |
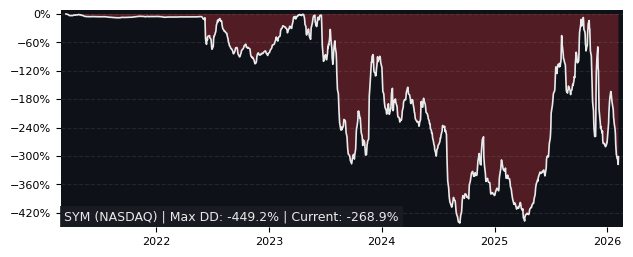
| Max Drawdown | 72.46% |
| Mean Drawdown | 36.69% |
Top Performer in Industrial Machinery & Supplies & Components (5/86)
| SYMBOL | 1W | 1M | 3M |
|---|---|---|---|
| NDX1 | 4.40% | 10.42% | 44.15% |
| ESE | 9.10% | 10.16% | 42.11% |
| GRC | 4.04% | 3.08% | 27.06% |
| CECO | 5.82% | 14.87% | 1.77% |
| AZ | 23.58% | 43.83% | 0.13% |
| SYM | 12.42% | 9.65% | -24.34% |
| SYMBOL | 6M | 12M | 5Y |
|---|---|---|---|
| RKLB | 15.68% | 286.24% | 509.09% |
| NVRI | 64.24% | 270.10% | 10.90% |
| NDX1 | 98.69% | 219.41% | 95.99% |
| ENR | 40.83% | 209.59% | 401.98% |
| GHM | 43.23% | 206.41% | 480.18% |
| SYM | -21.43% | 187.18% | 418.99% |
| SYMBOL | MCAP | 1M | 12M | 5Y | P/E | P/E fwd | PEG | EPS stab | EPS cagr |
|---|---|---|---|---|---|---|---|---|---|
| ESE NYSE ESCO Technologies |
7.57B | 10.2% | 106% | 170% | 60.6 | 25.4 | 1.67 | 74.8% | 28.0% |
| PH NYSE Parker-Hannifin |
115B | -1.26% | 73.2% | 206% | 33.1 | 27.3 | 3.74 | -22.4% | -44.9% |
| MWA NYSE Mueller Water Products |
4.32B | -0.64% | 22.9% | 111% | 21.8 | 19.1 | 1.27 | 81.7% | 19.2% |
| WTS NYSE Watts Water Technologies |
9.63B | -5.95% | 58.6% | 155% | 28.4 | 24.9 | 3.12 | 76.5% | 13.5% |
| SPXC NYSE SPX |
9.84B | -3.77% | 61.8% | 234% | 39.1 | 25.9 | 1.44 | 20.4% | -39.7% |
| NDSN NASDAQ Nordson |
14.7B | -3.23% | 56.3% | 38.6% | 28.5 | 22.8 | 1.77 | 34.0% | -0.66% |
| DOV NYSE Dover |
27.7B | -0.45% | 38.5% | 59.5% | 25.8 | 19.5 | 1.82 | 58.8% | 7.71% |
| SNA NYSE Snap-On |
19.0B | -1.58% | 21.1% | 77.8% | 19.1 | 18.3 | 2.03 | -35.7% | -46.0% |
| LECO NASDAQ Lincoln Electric Holdings |
13.4B | -8.89% | 43.0% | 113% | 26.2 | 22.6 | 1.61 | 68.2% | 6.40% |
| G1A XETRA GEA |
11.5B | 2.14% | 29.2% | 95.7% | 24.8 | 18.5 | 1.26 | 37.4% | 12.1% |
Performance: SYM vs S&P 500
| PERIOD | SYM | S&P 500 | DIFFERENCE |
|---|---|---|---|
| 1 Month | 9.65% | -1.73% | 11.58% |
| 3 Months | -24.34% | -4.49% | -20.78% |
| 6 Months | -21.43% | -1.33% | -20.37% |
| 12 Months | 187.18% | 32.14% | 117.33% |
| 5 Years | 418.99% | 72.70% | 200.51% |
SYM Performance FAQ
Does SYM outperform the market?
Yes, SYM significantly outperforms the market. Over the past 12 months, SYM returned 187.18% compared to 32.14% for the S&P 500.
What is the SYM return over the last 12 months?
SYM has returned 187.18% over the past 12 months, including dividends. Over 3 months the return was -24.34%, and over 5 years 418.99%.
How risky is SYM?
SYM has relatively low risk with a maximum drawdown of 72.46% over the past 3 years. The average drawdown is 36.69%.
SYM vs Sectors (12m)
Sorted by outperformance. Positive = SYM beats sector.
| SECTOR | ETF | DIFFERENCE 12M |
|---|---|---|
| Consumer Staples | XLP | 177.6% |
| Health Care | XLV | 176.5% |
| Real Estate | XLRE | 173.5% |
| Financials | XLF | 172.3% |
| Consumer Discretionary | XLY | 165.5% |
| Consumer Discretionary | XLY | 165.5% |
| Communication Services | XLC | 157.7% |
| Materials | XLB | 153.5% |
| Industrials | XLI | 145.1% |
| Technology | XLK | 137.2% |
| Energy | XLE | 129.8% |
SYM vs Asset Classes (12m)
| ASSET CLASS | ETF | DIFFERENCE 12M |
|---|---|---|
| S&P 500 | SPY | 117.33% |
| Gold | GLD | 130.9% |
| Long-Term Bonds | TLT | 186.6% |