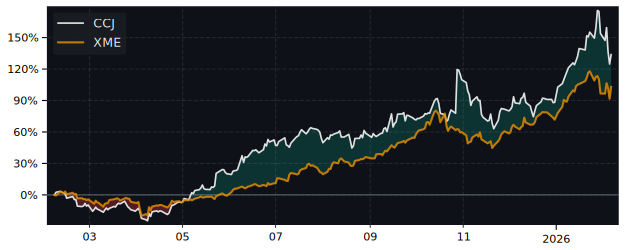
CCJ Performance: 197.2% Return (12 Months)
CCJ returned 197.2% over 12 months, outperforming the S&P 500 (32.2%). Volatility: 51.2%.
| P/E Trailing | 116 |
| P/E Forward | 105 |
| 52 Week High | 134.09 USD |
| 52 Week Low | 36.61 USD |
| VRO Trend Strength ±100 | 24.21 |
| Buy Signal ±3 | -0.61 |
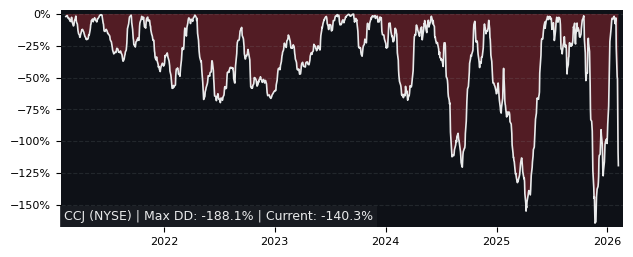
| Max Drawdown | 40.01% |
| Mean Drawdown | 9.87% |
Top Performer in Coal & Consumable Fuels (5/14)
| SYMBOL | 1W | 1M | 3M |
|---|---|---|---|
| TBN | -9.30% | 46.45% | 75.67% |
| ARLP | 0.29% | 1.80% | 19.48% |
| CCJ | 1.49% | -5.09% | 6.05% |
| DNN | -1.13% | -8.40% | 4.80% |
| BTU | -3.00% | -3.97% | -0.40% |
| URG | -2.01% | 1.39% | -10.98% |
| SYMBOL | 6M | 12M | 5Y |
|---|---|---|---|
| AREC | -42.80% | 420.59% | -40.19% |
| UUUU | -0.85% | 405.51% | 166.67% |
| UEC | -3.18% | 219.76% | 324.27% |
| CCJ | 27.76% | 197.21% | 548.44% |
| DNN | 22.46% | 195.76% | 200.86% |
| NXE | 27.93% | 177.07% | 184.71% |
Performance: CCJ vs S&P 500
| PERIOD | CCJ | S&P 500 | DIFFERENCE |
|---|---|---|---|
| 1 Month | -5.09% | -2.54% | -2.61% |
| 3 Months | 6.05% | -4.14% | 10.63% |
| 6 Months | 27.76% | -0.92% | 28.94% |
| 12 Months | 197.21% | 32.20% | 124.82% |
| 5 Years | 548.44% | 71.53% | 278.03% |
CCJ Performance FAQ
Does CCJ outperform the market?
Yes, CCJ significantly outperforms the market. Over the past 12 months, CCJ returned 197.21% compared to 32.20% for the S&P 500.
What is the CCJ return over the last 12 months?
CCJ has returned 197.21% over the past 12 months, including dividends. Over 3 months the return was 6.05%, and over 5 years 548.44%.
How risky is CCJ?
CCJ has relatively low risk with a maximum drawdown of 40.01% over the past 3 years. The average drawdown is 9.87%.
CCJ vs Sectors (12m)
Sorted by outperformance. Positive = CCJ beats sector.
| SECTOR | ETF | DIFFERENCE 12M |
|---|---|---|
| Consumer Staples | XLP | 189.5% |
| Health Care | XLV | 186.3% |
| Real Estate | XLRE | 183.7% |
| Financials | XLF | 182.3% |
| Consumer Discretionary | XLY | 176.9% |
| Communication Services | XLC | 167.6% |
| Communication Services | XLC | 167.6% |
| Materials | XLB | 163.9% |
| Industrials | XLI | 155.4% |
| Technology | XLK | 146.5% |
| Energy | XLE | 138.5% |
CCJ vs Asset Classes (12m)
| ASSET CLASS | ETF | DIFFERENCE 12M |
|---|---|---|
| S&P 500 | SPY | 124.82% |
| Gold | GLD | 139.5% |
| Long-Term Bonds | TLT | 196.6% |