FTI Performance: 142% Return (12 Months)
FTI returned 142.0% over 12 months, outperforming the S&P 500 (23.6%). Volatility: 35.6%.
| P/E Trailing | 30.3 |
| P/E Forward | 25.0 |
| 52 Week High | 71.19 USD |
| 52 Week Low | 23.06 USD |
| VRO Trend Strength ±100 | 65.13 |
| Buy Signal ±3 | 1.03 |
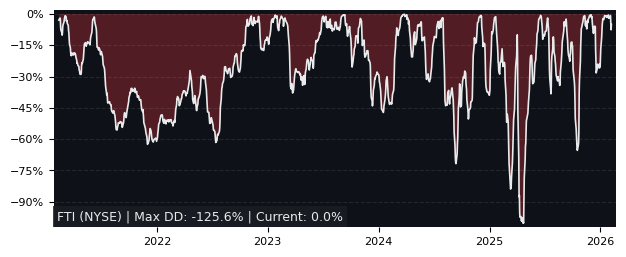
| Max Drawdown | 28.94% |
| Mean Drawdown | 5.38% |
Top Performer in Oil & Gas Equipment & Services (5/43)
| SYMBOL | 1W | 1M | 3M |
|---|---|---|---|
| SPM | 8.34% | 23.62% | 55.95% |
| FTI | -0.24% | 7.48% | 47.19% |
| TEN | -0.51% | 10.88% | 46.81% |
| ACDC | -8.30% | 21.36% | 46.51% |
| PUMP | -5.11% | 13.15% | 41.24% |
| SND | -6.76% | 24.39% | 23.19% |
| SYMBOL | 6M | 12M | 5Y |
|---|---|---|---|
| FET | 128.25% | 230.24% | 217.27% |
| NESR | 120.02% | 220.68% | 73.09% |
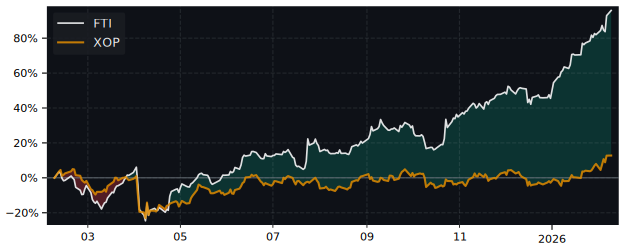
| FTI | 87.06% | 142.03% | 822.49% |
| SND | 143.17% | 132.70% | 124.34% |
| PUMP | 152.54% | 122.33% | 27.89% |
| LBRT | 119.40% | 119.03% | 160.11% |
| SYMBOL | MCAP | 1M | 12M | 5Y | P/E | P/E fwd | PEG | EPS stab | EPS cagr |
|---|---|---|---|---|---|---|---|---|---|
| SBMO AS SBM Offshore |
6.66B | 13.1% | 100% | 204% | 7.51 | 7.84 | 0.23 | 39.9% | - |
| SPM MI Saipem SpA |
8.80B | 23.6% | 125% | -25.3% | 24.5 | 21.9 | 0.37 | 45.2% | 567% |
| NPKI NYSE NPK International |
1.23B | 5.33% | 162% | 333% | 34.8 | 24.9 | 1.30 | 67.6% | 111% |
| TS NYSE Tenaris |
29.2B | 9.77% | 69.9% | 201% | 15.8 | 18.0 | 3.15 | -60.9% | -48.7% |
| TEN MI Tenaris S.A |
29.7B | 10.9% | 62.1% | 209% | 16.0 | 17.9 | 3.11 | -39.2% | 0.61% |
| TDW NYSE Tidewater |
4.08B | -3.75% | 123% | 557% | 12.4 | 36.4 | -0.04 | 35.4% | 94.4% |
| WFRD NASDAQ Weatherford International |
6.64B | -2.60% | 113% | 663% | 15.6 | 14.7 | 7.27 | 23.8% | 19.7% |
| SEI NYSE Solaris Energy |
5.39B | 17.5% | 207% | 446% | 87.6 | - | - | -33.2% | -29.0% |
| OII NYSE Oceaneering International |
3.62B | 1.11% | 81.2% | 198% | 10.4 | 18.8 | 8.01 | 54.5% | -28.2% |
Performance: FTI vs S&P 500
| PERIOD | FTI | S&P 500 | DIFFERENCE |
|---|---|---|---|
| 1 Month | 7.48% | -3.34% | 11.19% |
| 3 Months | 47.19% | -4.38% | 53.92% |
| 6 Months | 87.06% | -1.44% | 89.80% |
| 12 Months | 142.03% | 23.60% | 95.82% |
| 5 Years | 822.49% | 72.80% | 433.84% |
FTI Performance FAQ
Does FTI outperform the market?
Yes, FTI significantly outperforms the market. Over the past 12 months, FTI returned 142.03% compared to 23.60% for the S&P 500.
What is the FTI return over the last 12 months?
FTI has returned 142.03% over the past 12 months, including dividends. Over 3 months the return was 47.19%, and over 5 years 822.49%.
How risky is FTI?
FTI has relatively low risk with a maximum drawdown of 28.94% over the past 3 years. The average drawdown is 5.38%.
FTI vs Sectors (12m)
Sorted by outperformance. Positive = FTI beats sector.
| SECTOR | ETF | DIFFERENCE 12M |
|---|---|---|
| Consumer Staples | XLP | 139.4% |
| Health Care | XLV | 137.6% |
| Financials | XLF | 136.6% |
| Real Estate | XLRE | 136.6% |
| Consumer Discretionary | XLY | 127.9% |
| Consumer Discretionary | XLY | 127.9% |
| Communication Services | XLC | 119.8% |
| Materials | XLB | 118.3% |
| Industrials | XLI | 110.2% |
| Technology | XLK | 101.9% |
| Energy | XLE | 101% |
FTI vs Asset Classes (12m)
| ASSET CLASS | ETF | DIFFERENCE 12M |
|---|---|---|
| S&P 500 | SPY | 95.82% |
| Gold | GLD | 92.1% |
| Long-Term Bonds | TLT | 143.3% |