(THR) Thermon Holdings - Performance -16% in 12m
Compare THR with Indices, Sectors and Commodities and Bonds. Who performs better in which timeframe?
Performance Rating
35.95%
#28 in Group
Rel. Strength
31.49%
#5472 in Universe
Total Return 12m
-15.99%
#44 in Group
Total Return 5y
76.67%
#32 in Group
P/E 18.3
58th Percentile in Group
P/E Forward 11.9
36th Percentile in Group
PEG 4.04
97th Percentile in Group
FCF Yield 6.04%
70th Percentile in Group
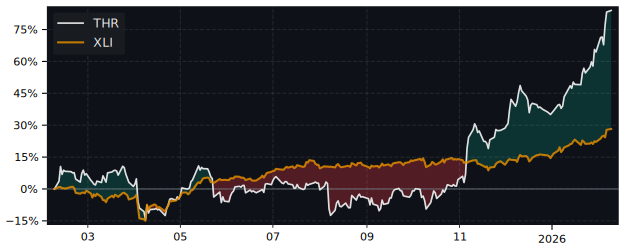
12m Total Return: THR (-16%) vs XLI (5.4%)
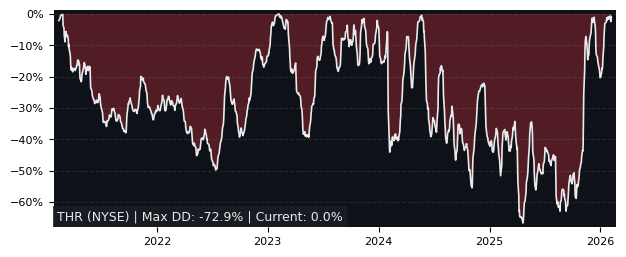
5y Drawdown (Underwater) Chart
Top Performers in Electrical Components & Equipment
Overall best picks of Peer Group Selected by proven GARP Predictive Metrics, sorted by Growth Rating
| Symbol | 1m | 12m | 5y | P/E | P/E Forward | PEG | EPS Stability |
EPS CAGR |
|---|---|---|---|---|---|---|---|---|
| RBC NYSE RBC Bearings |
-4.09% | 32.5% | 178% | 42.4 | 14.5 | 1.45 | 91.3% | 17.7% |
| POWL NASDAQ Powell Industries |
-7.86% | 31.2% | 747% | 12.5 | 12.4 | 0.89 | 90.6% | 247% |
| LYTS NASDAQ LSI Industries |
-8.56% | 14.2% | 231% | 20.3 | 14.1 | 0.39 | 64.7% | 37.7% |
| AYI NYSE Acuity Brands |
-13.2% | -7.01% | 181% | 18.2 | 14.3 | 1.32 | 74.6% | 7.72% |
| HUBB NYSE Hubbell |
0.77% | -12.5% | 218% | 22 | 17.9 | 1.8 | 87.6% | 26.6% |
| EMR NYSE Emerson Electric |
-11% | -7.26% | 119% | 26.6 | 17.1 | 1.35 | -14.1% | 2.34% |
| VRT NYSE Vertiv Holdings |
-13.5% | -9.51% | 616% | 56.9 | 22.1 | 0.63 | 57.4% | 43.4% |
| NKT CO NKT |
-3.16% | -15.4% | 324% | 15 | 37.6 | 0.01 | 89.9% | 88.1% |
Performance Comparison: THR vs XLI vs S&P 500
XLI (Industrial Sector SPDR ETF) is the Sector Benchmark for THR
| Total Return (including Dividends) | THR | XLI | S&P 500 |
|---|---|---|---|
| 1 Month | -16.66% | -4.70% | -5.89% |
| 3 Months | -16.61% | -10.60% | -12.45% |
| 12 Months | -15.99% | 5.36% | 6.72% |
| 5 Years | 76.67% | 120.63% | 101.06% |
| Trend Score (consistency of price movement) | THR | XLI | S&P 500 |
| 1 Month | -86.0% | -73.8% | -74.5% |
| 3 Months | -38.5% | -90.3% | -88.2% |
| 12 Months | -56.7% | 63.2% | 66.1% |
| 5 Years | 86.7% | 87.4% | 84.3% |
| Relative Strength (compared with Indexes) | Rank in Peer Group | vs. XLI | vs. S&P 500 |
| 1 Month | #73 | -12.6% | -11.5% |
| 3 Month | #36 | -6.72% | -4.75% |
| 12 Month | #44 | -20.3% | -21.3% |
| 5 Years | #33 | -19.9% | -12.1% |
FAQs
Does THR Thermon Holdings outperforms the market?
No,
over the last 12 months THR made -15.99%, while its related Sector, the Industrial Sector SPDR (XLI) made 5.36%.
Over the last 3 months THR made -16.61%, while XLI made -10.60%.
Over the last 3 months THR made -16.61%, while XLI made -10.60%.
Performance Comparison THR vs Indeces and Sectors
THR vs. Indices THR is Over or Underperforming
| Symbol | 1w | 1m | 6m | 12m | |
|---|---|---|---|---|---|
| US S&P 500 | SPY | 1.61% | -10.8% | -2.82% | -22.7% |
| US NASDAQ 100 | QQQ | 2.47% | -10.4% | -2.29% | -21.5% |
| US Dow Jones Industrial 30 | DIA | 2.78% | -10.8% | -3.36% | -21.3% |
| German DAX 40 | DAX | -3.75% | -7.26% | -19.9% | -34.2% |
| Shanghai Shenzhen CSI 300 | CSI 300 | 0.90% | -9.16% | -5.10% | -21.9% |
| Hongkong Hang Seng | HSI | -2.68% | -6.84% | -4.34% | -32.2% |
| India NIFTY 50 | INDA | -2.76% | -21.4% | -5.27% | -19.1% |
| Brasil Bovespa | EWZ | -1.95% | -11.6% | -5.77% | -6.52% |
THR vs. Sectors THR is Over or Underperforming
| Symbol | 1w | 1m | 6m | 12m | |
|---|---|---|---|---|---|
| Communication Services | XLC | 1.36% | -11.0% | -11.6% | -29.5% |
| Consumer Discretionary | XLY | 2.48% | -12.7% | -5.56% | -25.2% |
| Consumer Staples | XLP | -1.69% | -19.9% | -13.0% | -29.9% |
| Energy | XLE | -3.11% | -6.58% | -3.88% | -5.70% |
| Financial | XLF | 0.24% | -12.2% | -10.9% | -34.9% |
| Health Care | XLV | 1.21% | -9.29% | -1.42% | -15.5% |
| Industrial | XLI | 0.49% | -12.0% | -2.90% | -21.4% |
| Materials | XLB | -0.11% | -10.0% | 4.26% | -8.45% |
| Real Estate | XLRE | -3.73% | -13.8% | -4.17% | -33.1% |
| Technology | XLK | 2.97% | -7.73% | 3.99% | -14.8% |
| Utilities | XLU | -1.70% | -16.2% | -8.56% | -40.4% |
| Aerospace & Defense | XAR | -0.08% | -16.7% | -12.6% | -40.2% |
| Biotech | XBI | -1.95% | -4.78% | 11.7% | -7.08% |
| Homebuilder | XHB | 0.66% | -9.82% | 15.1% | -6.88% |
| Retail | XRT | -0.09% | -14.6% | 1.85% | -11.6% |