WPM Performance: 90.1% Return (12 Months)
WPM returned 90.1% over 12 months, outperforming the S&P 500 (25.4%). Volatility: 54.5%.
| P/E Trailing | 43.3 |
| P/E Forward | 27.6 |
| 52 Week High | 165.46 USD |
| 52 Week Low | 70.08 USD |
| VRO Trend Strength ±100 | 40.58 |
| Buy Signal ±3 | 0.03 |
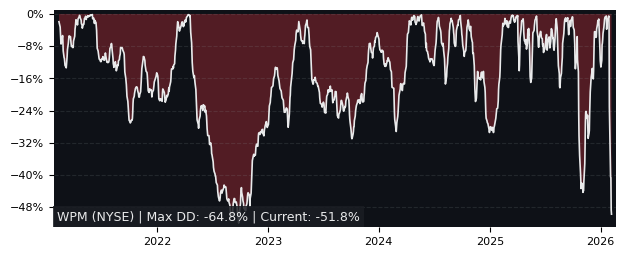
| Max Drawdown | 30.84% |
| Mean Drawdown | 7.88% |
Top Performer in Metals & Mining (5/132)
| SYMBOL | 1W | 1M | 3M |
|---|---|---|---|
| ALM | 14.78% | -10.51% | 104.29% |
| AUGO | 12.60% | 23.28% | 88.65% |
| SSRM | 5.79% | 10.85% | 51.79% |
| CENX | 5.98% | 21.78% | 45.13% |
| KRT | 7.15% | 31.48% | 25.11% |
| WPM | 3.93% | -4.62% | 13.13% |
| SYMBOL | 6M | 12M | 5Y |
|---|---|---|---|
| AUGO | 174.07% | 483.16% | 1140.39% |
| TRX | 100.00% | 457.14% | 174.26% |
| ALM | 125.16% | 412.13% | 844.04% |
| AP | 257.51% | 325.00% | 20.72% |
| CENX | 111.72% | 316.00% | 367.30% |
| WPM | 36.72% | 90.11% | 266.26% |
| SYMBOL | MCAP | 1M | 12M | 5Y | P/E | P/E fwd | PEG | EPS stab | EPS cagr |
|---|---|---|---|---|---|---|---|---|---|
| CRS NYSE Carpenter Technology |
21.3B | 8.95% | 147% | 1,017% | 45.7 | 23.4 | 1.59 | 97.0% | 137% |
| VOXR NASDAQ Vox Royalty Common Stock |
363M | -6.86% | 104% | 240% | 52.6 | 47.9 | - | -0.20% | -9.86% |
| ATI NYSE Allegheny Technologies |
20.1B | 1.87% | 228% | 627% | 51.6 | 34.8 | 1.33 | 87.6% | 25.2% |
| AUGO NASDAQ Aura Minerals Common Shares |
7.44B | 23.3% | 483% | 1,140% | - | 8.85 | - | -54.1% | -16.9% |
| BHP NYSE BHP |
196B | 5.95% | 81.4% | 74.4% | 19.1 | 14.6 | 5.95 | -18.2% | -41.4% |
| VK PA Vallourec |
5.90B | 18.7% | 75.1% | 156% | 15.5 | 8.44 | 7.24 | 33.0% | 173% |
| RIO NYSE Rio Tinto |
154B | 7.50% | 83.9% | 82.1% | 15.5 | 11.7 | 5.69 | -4.50% | - |
| VALE NYSE Vale |
72.2B | 8.61% | 105% | 52.7% | 30.4 | 7.16 | 12.4 | -66.1% | -20.7% |
| CGAU NYSE Centerra Gold |
3.65B | 1.76% | 226% | 144% | 6.44 | 8.11 | - | 67.3% | 18.1% |
| ERO NYSE Ero Copper |
3.00B | 9.29% | 189% | 79.5% | 11.4 | 5.83 | - | 26.5% | -10.2% |
Performance: WPM vs S&P 500
| PERIOD | WPM | S&P 500 |
|---|---|---|
| 1 Week | 3.93% | 3.67% |
| 1 Month | -4.62% | 0.52% |
| 3 Months | 13.13% | -1.77% |
| 6 Months | 36.72% | 1.88% |
| 12 Months | 90.11% | 25.35% |
| 5 Years | 266.26% | 76.85% |
WPM Performance FAQ
Does WPM outperform the market?
Yes, WPM significantly outperforms the market. Over the past 12 months, WPM returned 90.11% compared to 25.35% for the S&P 500.
What is the WPM return over the last 12 months?
WPM has returned 90.11% over the past 12 months, including dividends. Over 3 months the return was 13.13%, and over 5 years 266.26%.
How risky is WPM?
WPM has relatively low risk with a maximum drawdown of 30.84% over the past 3 years. The average drawdown is 7.88%.
WPM vs Sectors (12m)
Sorted by outperformance. Positive = WPM beats sector.
| SECTOR | ETF | DIFFERENCE 12M |
|---|---|---|
| Consumer Staples | XLP | 82% |
| Health Care | XLV | 80.6% |
| Financials | XLF | 79.8% |
| Real Estate | XLRE | 77.3% |
| Consumer Discretionary | XLY | 73.9% |
| Communication Services | XLC | 66.7% |
| Communication Services | XLC | 66.7% |
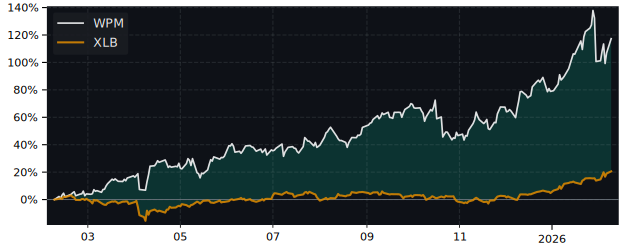
| Materials | XLB | 59.6% |
| Industrials | XLI | 52.4% |
| Technology | XLK | 49.9% |
| Energy | XLE | 46.4% |
WPM vs Asset Classes (12m)
| ASSET CLASS | ETF | DIFFERENCE 12M |
|---|---|---|
| S&P 500 | SPY | 64.8% |
| Emerging Market | EEM | 40.2% |
| Gold | GLD | 36.7% |
| Long-Term Bonds | TLT | 88.1% |
| Risk-Free Cash | SHY | 86.5% |