(AZAL) AllianzIM U.S. Large - Performance 6.8% in 12m
Compare AZAL with Indices, Sectors and Commodities and Bonds. Who performs better in which timeframe?
Performance Rating
76.93%
#28 in Group
Rel. Strength 12m
58.51%
#3248 in Universe
Total Return 12m
6.82%
#101 in Group
Total Return 5y
57.21%
#40 in Group
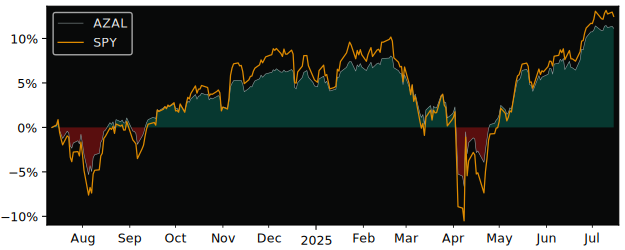
12m Total Return: AZAL (6.8%) vs SPY (10.7%)
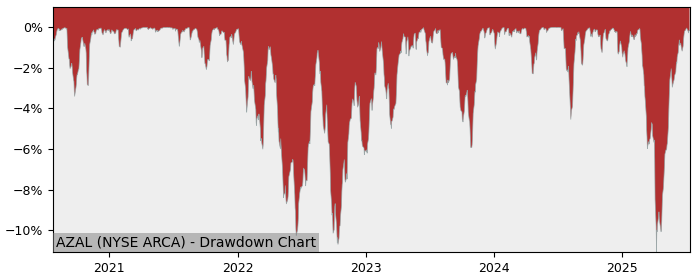
5y Drawdown (Underwater) Chart
Top Performers in Defined Outcome
Overall best picks of Peer Group (based on Performance, Valuations and Relative Strength)
| Symbol | 1m | 12m | 5y | P/E | P/B | Growth Rating |
|---|---|---|---|---|---|---|
| BFEB BATS Innovator SP500 Buffer - |
-5.17% | 7.29% | 113% | - | - | 88.64 |
| BMAR BATS Innovator SP500 Buffer - |
-4.10% | 11.1% | 106% | - | - | 87.65 |
| FFEB BATS FT Cboe Vest U.S. Equity |
-3.79% | 9.56% | 104% | - | - | 87.14 |
| PJUL BATS Innovator SP500 Power |
-4.14% | 7.03% | 78.0% | - | - | 86.16 |
| POCT BATS Innovator SP500 Power |
-3.61% | 4.64% | 82.5% | - | - | 86.04 |
Performance Duell AZAL vs SPY
| Total Return (including Dividends) | AZAL | SPY | S&P 500 |
|---|---|---|---|
| 1 Month | -6.89% | -7.69% | -7.69% |
| 3 Months | -5.80% | -6.94% | -6.94% |
| 12 Months | 6.82% | 10.70% | 10.70% |
| 5 Years | 57.21% | 153.10% | 153.10% |
| Relative Strength (compared with Indexes) | Rank in Peer Group | vs. SPY | vs. S&P 500 |
| 1 Month | #161 | 2.95% | 2.95% |
| 3 Month | #161 | 3.31% | 3.31% |
| 12 Month | #47 | -1.51% | -1.51% |
| 5 Years | #127 | -17.7% | -17.7% |
| Trend Score (consistency of price movement) | AZAL | SPY | S&P 500 |
| 1 Month | -94.8% | -96% | -96% |
| 3 Months | -3.2% | -21% | -21% |
| 12 Months | 93.3% | 91% | 91% |
| 5 Years | 91.6% | 84.5% | 84.5% |
FAQs
Does AZAL AllianzIM U.S. Large outperforms the market?
No,
over the last 12 months AZAL made 6.82%, while its related Sector, the SPDR SP500 Trust (SPY) made 10.70%.
Over the last 3 months AZAL made -5.80%, while SPY made -6.94%.
Over the last 3 months AZAL made -5.80%, while SPY made -6.94%.
Performance Comparison AZAL vs Indeces and Sectors
AZAL vs. Indices AZAL is Over or Underperforming
| Symbol | 1w | 1m | 6m | 12m | |
|---|---|---|---|---|---|
| US S&P 500 | SPY | -1.01% | 0.80% | -1.42% | -3.88% |
| US NASDAQ 100 | QQQ | -0.82% | 3.98% | -2.44% | -3.06% |
| US Dow Jones Industrial 30 | DIA | -0.28% | -0.20% | -1.16% | -1.44% |
| German DAX 40 | DAX | -3.28% | -9.09% | -24.1% | -20.7% |
| Shanghai Shenzhen CSI 300 | CSI 300 | -6.55% | -9.58% | -25.9% | -8.56% |
| Hongkong Hang Seng | HSI | -2.42% | -13.8% | -16.2% | -7.67% |
| India NIFTY 50 | INDA | -2.94% | -5.52% | 14.5% | 9.67% |
| Brasil Bovespa | EWZ | -7.40% | -4.88% | 9.10% | 20.6% |
AZAL vs. Sectors AZAL is Over or Underperforming
| Symbol | 1w | 1m | 6m | 12m | |
|---|---|---|---|---|---|
| Communication Services | XLC | 0.41% | 1.40% | -11.4% | -15.1% |
| Consumer Discretionary | XLY | 1.07% | 6.46% | -3.55% | -3.46% |
| Consumer Staples | XLP | 0.75% | -5.53% | 3.64% | -1.36% |
| Energy | XLE | -5.95% | -6.55% | -6.20% | 5.23% |
| Financial | XLF | -2.07% | -0.56% | -9.24% | -13.9% |
| Health Care | XLV | -0.38% | -6.98% | 6.29% | 5.94% |
| Industrial | XLI | -0.97% | -2.22% | -1.53% | -2.25% |
| Materials | XLB | -1.19% | -2.58% | 6.42% | 10.4% |
| Real Estate | XLRE | -0.89% | -5.44% | 6.21% | -3.03% |
| Technology | XLK | -1.19% | 3.96% | 1.46% | 3.65% |
| Utilities | XLU | -5.33% | -6.60% | -1.95% | -21.6% |
| Aerospace & Defense | XAR | -3.80% | -2.75% | -7.30% | -11.7% |
| Biotech | XBI | -3.10% | -2.21% | 13.2% | 14.4% |
| Homebuilder | XHB | 1.0% | 1.72% | 18.1% | 13.3% |
| Retail | XRT | 2.58% | 8.02% | 9.17% | 15.7% |