(DUKQ) Northern Lights Fund - Performance 0.1% in 12m
Compare DUKQ with Indices, Sectors and Commodities and Bonds. Who performs better in which timeframe?
Performance Rating
12.37%
#193 in Group
Rel. Strength
58.68%
#3173 in Universe
Total Return 12m
0.11%
#189 in Group
Total Return 5y
0.11%
#196 in Group
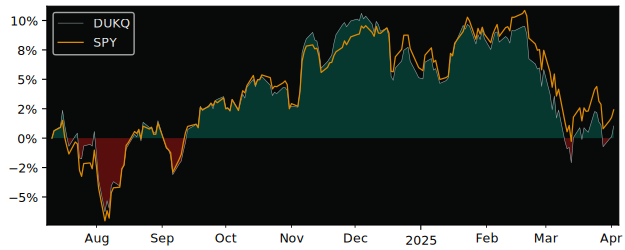
12m Total Return: DUKQ (0.1%) vs SPY (8.8%)
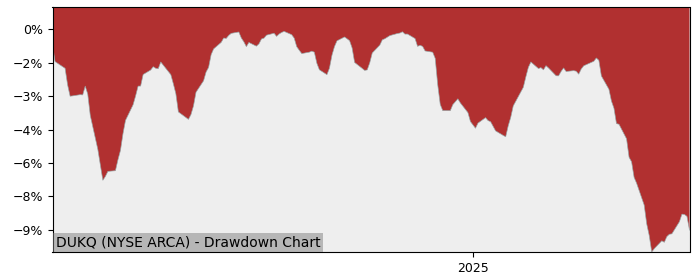
5y Drawdown (Underwater) Chart
Top Performers in Large Blend
Overall best picks of Peer Group Selected by proven GARP Predictive Metrics, sorted by Growth Rating
| Symbol | 1m | 12m | 5y | P/E | P/E Forward | PEG | EPS Stability |
EPS CAGR |
|---|---|---|---|---|---|---|---|---|
| FCPI BATS Fidelity Stocks Inflation |
-1.48% | 11.5% | 157% | - | - | - | - | - |
| FFLC BATS Fidelity Fundamental Large |
-3.34% | 5.77% | 126% | - | - | - | - | - |
| FMIL BATS Fidelity New Millennium |
-3.74% | 5.33% | 123% | - | - | - | - | - |
| JQUA NYSE ARCA JPMorgan U.S. Quality |
-3.37% | 8.99% | 147% | - | - | - | - | - |
| SPMO NYSE ARCA Invesco SP500 Momentum |
-4.41% | 17% | 182% | - | - | - | - | - |
| RECS NYSE ARCA Columbia Trust I |
-3.42% | 8.84% | 152% | - | - | - | - | - |
| DGRW NASDAQ WisdomTree U.S. Quality |
-2.33% | 7.27% | 133% | - | - | - | - | - |
| LRGF NYSE ARCA iShares U.S. Equity Factor |
-3.95% | 9.45% | 148% | - | - | - | - | - |
Performance Comparison: DUKQ vs SPY vs S&P 500
SPY (SPDR SP500 Trust ETF) is the Sector Benchmark for DUKQ
| Total Return (including Dividends) | DUKQ | SPY | S&P 500 |
|---|---|---|---|
| 1 Month | -3.49% | -3.62% | -3.62% |
| 3 Months | -4.69% | -3.76% | -3.76% |
| 12 Months | 0.11% | 8.80% | 8.80% |
| 5 Years | 0.11% | 143.09% | 143.09% |
| Trend Score (consistency of price movement) | DUKQ | SPY | S&P 500 |
| 1 Month | -18.2% | -17.5% | -17.5% |
| 3 Months | -62.0% | -55.3% | -55.3% |
| 12 Months | 48.5% | 84.8% | 84.8% |
| 5 Years | 48.5% | 84.4% | 84.4% |
| Relative Strength (compared with Indexes) | Rank in Peer Group | vs. SPY | vs. S&P 500 |
| 1 Month | #99 | 0.13% | 0.13% |
| 3 Month | #164 | -0.97% | -0.97% |
| 12 Month | #126 | -1.63% | -1.63% |
| 5 Years | #82 | -1.63% | -1.63% |
FAQs
Does DUKQ Northern Lights Fund outperforms the market?
No,
over the last 12 months DUKQ made 0.11%, while its related Sector, the SPDR SP500 Trust (SPY) made 8.80%.
Over the last 3 months DUKQ made -4.69%, while SPY made -3.76%.
Over the last 3 months DUKQ made -4.69%, while SPY made -3.76%.
Performance Comparison DUKQ vs Indeces and Sectors
DUKQ vs. Indices DUKQ is Over or Underperforming
| Symbol | 1w | 1m | 6m | 12m | |
|---|---|---|---|---|---|
| US S&P 500 | SPY | 0.49% | 0.13% | -1.68% | -8.69% |
| US NASDAQ 100 | QQQ | 2.18% | 1.27% | -0.92% | -6.78% |
| US Dow Jones Industrial 30 | DIA | -0.57% | -0.78% | -2.71% | -7.75% |
| German DAX 40 | DAX | 0.57% | -0.68% | -19.5% | -22.3% |
| Shanghai Shenzhen CSI 300 | CSI 300 | -0.50% | -3.76% | 6.53% | -8.97% |
| Hongkong Hang Seng | HSI | -2.31% | -5.97% | 2.71% | -18.1% |
| India NIFTY 50 | INDA | -0.13% | -10.3% | 9.22% | 0.25% |
| Brasil Bovespa | EWZ | -0.97% | -11.8% | 4.92% | 11.4% |
DUKQ vs. Sectors DUKQ is Over or Underperforming
| Symbol | 1w | 1m | 6m | 12m | |
|---|---|---|---|---|---|
| Communication Services | XLC | 1.40% | 0.65% | -9.67% | -18.5% |
| Consumer Discretionary | XLY | 1.08% | 2.13% | -2.85% | -10.2% |
| Consumer Staples | XLP | -5.98% | -1.94% | -2.55% | -10.7% |
| Energy | XLE | -2.86% | -11.4% | -8.78% | -1.97% |
| Financial | XLF | -0.68% | 0.01% | -13.6% | -20.5% |
| Health Care | XLV | -0.70% | 0.31% | 3.25% | 0.67% |
| Industrial | XLI | -0.04% | -1.87% | -0.46% | -6.91% |
| Materials | XLB | -1.78% | -3.18% | 6.94% | 5.18% |
| Real Estate | XLRE | -3.39% | -0.34% | 1.65% | -11.5% |
| Technology | XLK | 2.71% | 1.23% | 2.85% | -0.17% |
| Utilities | XLU | -4.80% | -3.84% | -0.98% | -24.7% |
| Aerospace & Defense | XAR | 2.83% | -3.18% | -4.78% | -17.2% |
| Biotech | XBI | 8.21% | 5.20% | 17.8% | 16.7% |
| Homebuilder | XHB | 0.39% | -2.0% | 19.0% | 11.2% |
| Retail | XRT | -1.09% | -0.84% | 5.09% | 9.58% |