IAUM Performance: 57.1% Return (12 Months)
IAUM returned 57.1% over 12 months, outperforming the S&P 500 (31.5%). Volatility: 37.5%.
| P/E Trailing | - |
| P/E Forward | - |
| 52 Week High | 53.79 USD |
| 52 Week Low | 29.65 USD |
| VRO Trend Strength ±100 | 6.81 |
| Buy Signal ±3 | -0.26 |
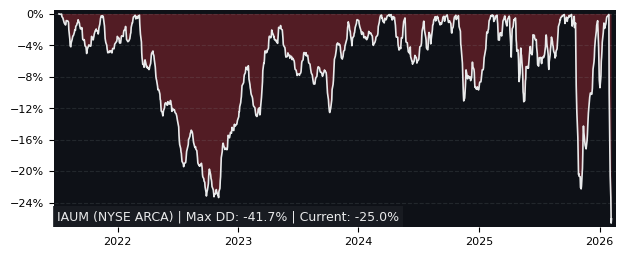
| Max Drawdown | 19.15% |
| Mean Drawdown | 3.19% |
Top Performer in Commodities Focused (5/32)
| SYMBOL | 1W | 1M | 3M |
|---|---|---|---|
| USO | 6.23% | 43.20% | 96.41% |
| BNO | 0.24% | 34.49% | 88.24% |
| DBE | -0.82% | 26.53% | 73.50% |
| UGA | -0.16% | 25.88% | 70.73% |
| DBO | -6.72% | 15.12% | 56.61% |
| IAUM | 3.49% | -7.95% | 5.10% |
| SYMBOL | 6M | 12M | 5Y |
|---|---|---|---|
| SLV | 49.32% | 142.41% | 184.93% |
| SIVR | 49.33% | 142.15% | 187.96% |
| USO | 89.27% | 109.03% | 242.40% |
| BNO | 81.67% | 101.71% | 244.49% |
| UGA | 66.22% | 85.79% | 234.54% |
| IAUM | 17.96% | 57.07% | 163.09% |
| SYMBOL | MCAP | 1M | 12M | 5Y | P/E | P/E fwd | PEG | EPS stab | EPS cagr |
|---|---|---|---|---|---|---|---|---|---|
| UGA NYSE ARCA United States Gasoline Fund |
145M | 25.9% | 85.8% | 235% | - | - | - | - | - |
| BNO NYSE ARCA United States Brent Oil Fund |
926M | 34.5% | 102% | 244% | - | - | - | - | - |
| USO NYSE ARCA United States Oil Fund |
2.61B | 43.2% | 109% | 242% | - | - | - | - | - |
| DBE NYSE ARCA DB Energy Fund |
83.5M | 26.5% | 81.6% | 169% | - | - | - | - | - |
| DBO NYSE ARCA DB Oil Fund |
391M | 15.1% | 59.6% | 110% | - | - | - | - | - |
| GLDM NYSE ARCA Gold Mini Shares |
29.1B | -7.87% | 56.9% | 169% | - | - | - | - | - |
| IAUM NYSE ARCA Gold Trust Micro |
7.07B | -7.95% | 57.1% | 163% | - | - | - | - | - |
| OUNZ NYSE ARCA Merk Gold Trust |
2.74B | -7.93% | 56.8% | 167% | - | - | - | - | - |
| AAAU BATS Goldman Sachs Physical Gold |
2.77B | -7.95% | 56.6% | 168% | - | - | - | - | - |
| BAR NYSE ARCA GraniteShares Gold Trust |
1.57B | -7.92% | 56.9% | 168% | - | - | - | - | - |
Performance: IAUM vs S&P 500
| PERIOD | IAUM | S&P 500 | DIFFERENCE |
|---|---|---|---|
| 1 Month | -7.95% | -3.48% | -4.63% |
| 3 Months | 5.10% | -4.38% | 9.91% |
| 6 Months | 17.96% | -1.79% | 20.11% |
| 12 Months | 57.07% | 31.52% | 19.42% |
| 5 Years | 163.09% | 72.80% | 60.90% |
IAUM Performance FAQ
Does IAUM outperform the market?
Yes, IAUM significantly outperforms the market. Over the past 12 months, IAUM returned 57.07% compared to 31.52% for the S&P 500.
What is the IAUM return over the last 12 months?
IAUM has returned 57.07% over the past 12 months, including dividends. Over 3 months the return was 5.10%, and over 5 years 163.09%.
How risky is IAUM?
IAUM has relatively low risk with a maximum drawdown of 19.15% over the past 3 years. The average drawdown is 3.19%.
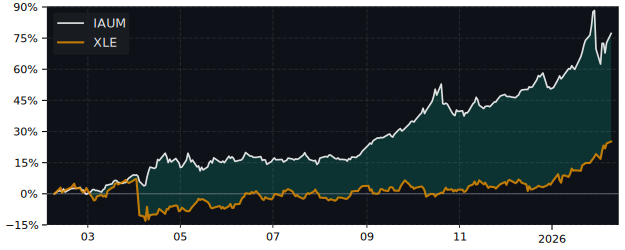
IAUM vs Sectors (12m)
Sorted by outperformance. Positive = IAUM beats sector.
| SECTOR | ETF | DIFFERENCE 12M |
|---|---|---|
| Consumer Staples | XLP | 48.6% |
| Health Care | XLV | 46% |
| Real Estate | XLRE | 43.8% |
| Financials | XLF | 43% |
| Consumer Discretionary | XLY | 36.4% |
| Communication Services | XLC | 27.6% |
| Communication Services | XLC | 27.6% |
| Materials | XLB | 22.9% |
| Industrials | XLI | 15.7% |
| Technology | XLK | 8% |
| Energy | XLE | 0.8% |
IAUM vs Asset Classes (12m)
| ASSET CLASS | ETF | DIFFERENCE 12M |
|---|---|---|
| S&P 500 | SPY | 19.42% |
| Gold | GLD | 0.2% |
| Long-Term Bonds | TLT | 56.3% |