(INT) Intellego Technologies - Performance 142.8% in 12m
Compare INT with Indices, Sectors and Commodities and Bonds. Who performs better in which timeframe?
Performance Rating
72.05%
(?) in Group
Rel. Strength
-%
(?) in Universe
Total Return 12m
142.77%
(?) in Group
Total Return 5y
1338.97%
(?) in Group
P/E 19.2
(?) Percentile in Group
P/E Forward -
(?) Percentile in Group
PEG -
(?) Percentile in Group
FCF Yield -2.21%
(?) Percentile in Group
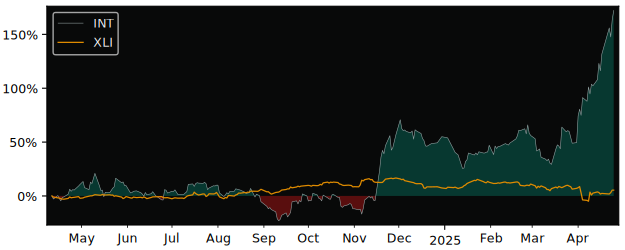
12m Total Return: INT (142.8%) vs XLI (5%)
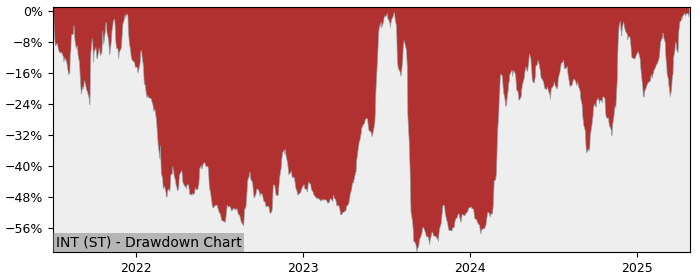
5y Drawdown (Underwater) Chart
Top Performers in Peer Group
Short Term
| Symbol | 1w | 1m | 3m |
|---|---|---|---|
| INT | 13.7% | 61.3% | 65.7% |
Long Term
| Symbol | 6m | 12m | 5y |
|---|---|---|---|
| INT | 129% | 143% | 1339% |
Overall best picks of Peer Group Selected by proven GARP Predictive Metrics, sorted by Growth Rating
| Symbol | 1m | 12m | 5y | P/E | P/E Forward | PEG | EPS Stability |
EPS CAGR |
||||||||||||||||||||||||||||||||||||||||||||||||||||||||||||||||||||||||||||||||||||||||||
|---|---|---|---|---|---|---|---|---|---|---|---|---|---|---|---|---|---|---|---|---|---|---|---|---|---|---|---|---|---|---|---|---|---|---|---|---|---|---|---|---|---|---|---|---|---|---|---|---|---|---|---|---|---|---|---|---|---|---|---|---|---|---|---|---|---|---|---|---|---|---|---|---|---|---|---|---|---|---|---|---|---|---|---|---|---|---|---|---|---|---|---|---|---|---|---|---|---|---|
| No best picks found. Look like this Industry is currently overvalued. | ||||||||||||||||||||||||||||||||||||||||||||||||||||||||||||||||||||||||||||||||||||||||||||||||||
Performance Comparison: INT vs XLI vs S&P 500
XLI (Industrial Sector SPDR ETF) is the Sector Benchmark for INT
| Total Return (including Dividends) | INT | XLI | S&P 500 |
|---|---|---|---|
| 1 Month | 61.32% | -5.46% | -6.90% |
| 3 Months | 65.68% | -8.76% | -11.64% |
| 12 Months | 142.77% | 5.00% | 6.50% |
| 5 Years | 1338.97% | 120.63% | 101.06% |
| Trend Score (consistency of price movement) | INT | XLI | S&P 500 |
| 1 Month | 92.6% | -73.8% | -74.5% |
| 3 Months | 64.4% | -90.3% | -88.2% |
| 12 Months | 60.7% | 63.2% | 66.1% |
| 5 Years | 80.9% | 87.4% | 84.3% |
| Relative Strength (compared with Indexes) | Rank in Peer Group | vs. XLI | vs. S&P 500 |
| 1 Month | - | 70.6% | 73.3% |
| 3 Month | - | 81.6% | 87.5% |
| 12 Month | - | 131% | 128% |
| 5 Years | - | 1,005% | 1,001% |
FAQs
Does INT Intellego Technologies outperforms the market?
Yes,
over the last 12 months INT made 142.77%, while its related Sector, the Industrial Sector SPDR (XLI) made 5.00%.
Over the last 3 months INT made 65.68%, while XLI made -8.76%.
Over the last 3 months INT made 65.68%, while XLI made -8.76%.
Performance Comparison INT vs Indeces and Sectors
INT vs. Indices INT is Over or Underperforming
| Symbol | 1w | 1m | 6m | 12m | |
|---|---|---|---|---|---|
| US S&P 500 | SPY | 13.4% | 68.2% | 138% | 136% |
| US NASDAQ 100 | QQQ | 14.2% | 69.2% | 138% | 138% |
| US Dow Jones Industrial 30 | DIA | 14.8% | 67.7% | 138% | 137% |
| German DAX 40 | DAX | 10.6% | 69.8% | 121% | 124% |
| Shanghai Shenzhen CSI 300 | CSI 300 | 12.6% | 69.3% | 131% | 137% |
| Hongkong Hang Seng | HSI | 9.54% | 72.0% | 135% | 126% |
| India NIFTY 50 | INDA | 10.3% | 55.6% | 136% | 140% |
| Brasil Bovespa | EWZ | 9.47% | 66.0% | 136% | 152% |
INT vs. Sectors INT is Over or Underperforming
| Symbol | 1w | 1m | 6m | 12m | |
|---|---|---|---|---|---|
| Communication Services | XLC | 14.1% | 68.3% | 129% | 129% |
| Consumer Discretionary | XLY | 15.1% | 67.0% | 135% | 134% |
| Consumer Staples | XLP | 10.6% | 59.3% | 128% | 128% |
| Energy | XLE | 7.86% | 71.3% | 138% | 153% |
| Financial | XLF | 12.1% | 66.0% | 130% | 123% |
| Health Care | XLV | 13.3% | 68.7% | 140% | 143% |
| Industrial | XLI | 12.3% | 66.8% | 138% | 138% |
| Materials | XLB | 10.4% | 68.1% | 145% | 150% |
| Real Estate | XLRE | 8.34% | 64.8% | 137% | 126% |
| Technology | XLK | 14.5% | 71.6% | 145% | 145% |
| Utilities | XLU | 10.6% | 62.4% | 132% | 118% |
| Aerospace & Defense | XAR | 11.4% | 62.0% | 129% | 119% |
| Biotech | XBI | 7.70% | 75.3% | 153% | 153% |
| Homebuilder | XHB | 13.2% | 68.7% | 156% | 152% |
| Retail | XRT | 13.1% | 64.8% | 143% | 147% |