(AII) Almonty Industries - Performance 279% in 12m
Compare AII with Indices, Sectors and Commodities and Bonds. Who performs better in which timeframe?
Performance Rating
53.06%
#29 in Group
Rel. Strength
99.19%
#66 in Universe
Total Return 12m
279.03%
#7 in Group
Total Return 5y
351.92%
#25 in Group
P/E -
(?) Percentile in Group
P/E Forward 54.6
83th Percentile in Group
PEG -
(?) Percentile in Group
FCF Yield -5.91%
(?) Percentile in Group
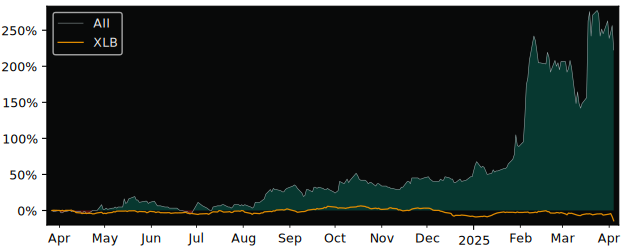
12m Total Return: AII (279%) vs XLB (-5.3%)
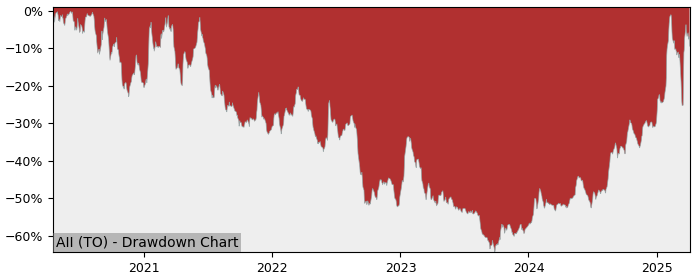
5y Drawdown (Underwater) Chart
Top Performers in Diversified Metals & Mining
Overall best picks of Peer Group Selected by proven GARP Predictive Metrics, sorted by Growth Rating
Performance Comparison: AII vs XLB vs S&P 500
XLB (Materials Sector SPDR Fund ETF) is the Sector Benchmark for AII
| Total Return (including Dividends) | AII | XLB | S&P 500 |
|---|---|---|---|
| 1 Month | 1.73% | -4.51% | -4.31% |
| 3 Months | 121.70% | -6.78% | -7.85% |
| 12 Months | 279.03% | -5.34% | 10.76% |
| 5 Years | 351.92% | 78.31% | 106.31% |
| Trend Score (consistency of price movement) | AII | XLB | S&P 500 |
| 1 Month | 61.2% | -31.2% | -35.6% |
| 3 Months | 78.7% | -88.3% | -89.7% |
| 12 Months | 95.5% | -34.8% | 58.3% |
| 5 Years | -6.90% | 77.3% | 84.2% |
| Relative Strength (compared with Indexes) | Rank in Peer Group | vs. XLB | vs. S&P 500 |
| 1 Month | #70 | 6.53% | 6.32% |
| 3 Month | #3 | 138% | 141% |
| 12 Month | #8 | 300% | 242% |
| 5 Years | #25 | 153% | 119% |
FAQs
Does AII Almonty Industries outperforms the market?
Yes,
over the last 12 months AII made 279.03%, while its related Sector, the Materials Sector SPDR Fund (XLB) made -5.34%.
Over the last 3 months AII made 121.70%, while XLB made -6.78%.
Over the last 3 months AII made 121.70%, while XLB made -6.78%.
Performance Comparison AII vs Indeces and Sectors
AII vs. Indices AII is Over or Underperforming
| Symbol | 1w | 1m | 6m | 12m | |
|---|---|---|---|---|---|
| US S&P 500 | SPY | -15.0% | 6.04% | 178% | 268% |
| US NASDAQ 100 | QQQ | -17.0% | 5.97% | 178% | 267% |
| US Dow Jones Industrial 30 | DIA | -12.9% | 7.51% | 177% | 272% |
| German DAX 40 | DAX | -12.3% | 5.54% | 159% | 256% |
| Shanghai Shenzhen CSI 300 | CSI 300 | -8.46% | 5.23% | 179% | 270% |
| Hongkong Hang Seng | HSI | -12.7% | 4.61% | 176% | 265% |
| India NIFTY 50 | INDA | -7.56% | 0.17% | 176% | 277% |
| Brasil Bovespa | EWZ | -14.7% | -0.24% | 173% | 285% |
AII vs. Sectors AII is Over or Underperforming
| Symbol | 1w | 1m | 6m | 12m | |
|---|---|---|---|---|---|
| Communication Services | XLC | -14.9% | 7.31% | 169% | 257% |
| Consumer Discretionary | XLY | -17.3% | 5.77% | 174% | 265% |
| Consumer Staples | XLP | -7.53% | -1.02% | 172% | 270% |
| Energy | XLE | -11.6% | 13.4% | 180% | 291% |
| Financial | XLF | -13.0% | 6.51% | 169% | 260% |
| Health Care | XLV | -12.0% | 6.70% | 180% | 279% |
| Industrial | XLI | -13.2% | 5.80% | 177% | 272% |
| Materials | XLB | -11.7% | 6.24% | 184% | 284% |
| Real Estate | XLRE | -10.2% | 3.64% | 180% | 264% |
| Technology | XLK | -18.8% | 6.25% | 182% | 273% |
| Utilities | XLU | -10.8% | 0.05% | 174% | 259% |
| Aerospace & Defense | XAR | -14.6% | 2.03% | 166% | 252% |
| Biotech | XBI | -14.1% | 9.57% | 191% | 281% |
| Homebuilder | XHB | -13.2% | 7.75% | 193% | 287% |
| Retail | XRT | -12.2% | 4.66% | 182% | 283% |