(XCSR) iShares ESG Advanced - Performance 22.2% in 12m
Compare XCSR with Indices, Sectors and Commodities and Bonds. Who performs better in which timeframe?
Performance Rating
76.86%
#25 in Group
Rel. Strength
78.57%
#1720 in Universe
Total Return 12m
22.23%
#4 in Group
Total Return 5y
103.57%
#9 in Group
P/E -
(?) Percentile in Group
P/E Forward -
(?) Percentile in Group
PEG -
(?) Percentile in Group
FCF Yield -
(?) Percentile in Group
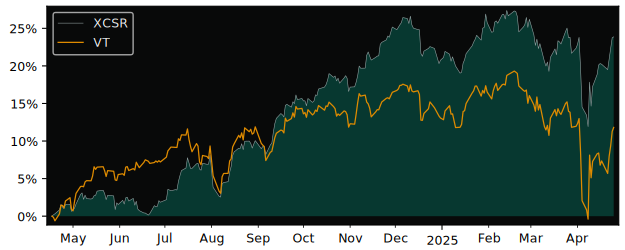
12m Total Return: XCSR (22.2%) vs VT (9.7%)
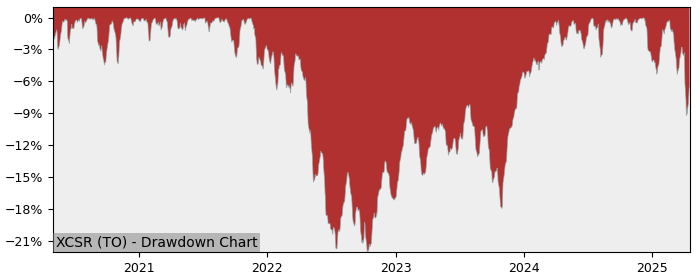
5y Drawdown (Underwater) Chart
Top Performers in Canadian Equity
Overall best picks of Peer Group Selected by proven GARP Predictive Metrics, sorted by Growth Rating
| Symbol | 1m | 12m | 5y | P/E | P/E Forward | PEG | EPS Stability |
EPS CAGR |
|---|---|---|---|---|---|---|---|---|
| ZLB TO BMO Low Volatility Canadian |
2.75% | 20.6% | 88% | - | - | - | - | - |
| VCE TO Vanguard FTSE Canada |
-1.99% | 16.8% | 102% | - | - | - | - | - |
| QCN TO Mackenzie Canadian Equity |
-1.96% | 16.5% | 103% | - | - | - | - | - |
| VCN TO Vanguard FTSE Canada All |
-1.94% | 17.1% | 99.2% | - | - | - | - | - |
| HXT TO Global X S&P/TSX 60 Index |
-2.01% | 16.7% | 96.7% | - | - | - | - | - |
| TTP TO TD Canadian Equity Index |
-1.88% | 15.7% | 98.1% | - | - | - | - | - |
| ZCN TO BMO S&P/TSX Capped |
-1.99% | 16.3% | 96.3% | - | - | - | - | - |
| XIU TO iShares S&P/TSX 60 |
-2.03% | 16.7% | 95.8% | - | - | - | - | - |
Performance Comparison: XCSR vs VT vs S&P 500
VT (Vanguard Total World Stock ETF) is the Sector Benchmark for XCSR
| Total Return (including Dividends) | XCSR | VT | S&P 500 |
|---|---|---|---|
| 1 Month | -0.65% | -3.22% | -4.77% |
| 3 Months | -0.26% | -5.15% | -9.81% |
| 12 Months | 22.23% | 9.71% | 9.54% |
| 5 Years | 103.57% | 86.45% | 104.83% |
| Trend Score (consistency of price movement) | XCSR | VT | S&P 500 |
| 1 Month | -22.2% | -44.9% | -51.2% |
| 3 Months | -75.0% | -86.8% | -90.1% |
| 12 Months | 86.0% | 62.5% | 59.4% |
| 5 Years | 74.6% | 72.6% | 84.2% |
| Relative Strength (compared with Indexes) | Rank in Peer Group | vs. VT | vs. S&P 500 |
| 1 Month | #6 | 2.66% | 4.33% |
| 3 Month | #5 | 5.15% | 10.6% |
| 12 Month | #4 | 11.4% | 11.6% |
| 5 Years | #12 | 9.19% | -0.62% |
FAQs
Does XCSR iShares ESG Advanced outperforms the market?
Yes,
over the last 12 months XCSR made 22.23%, while its related Sector, the Vanguard Total World Stock (VT) made 9.71%.
Over the last 3 months XCSR made -0.26%, while VT made -5.15%.
Over the last 3 months XCSR made -0.26%, while VT made -5.15%.
Performance Comparison XCSR vs Indeces and Sectors
XCSR vs. Indices XCSR is Over or Underperforming
| Symbol | 1w | 1m | 6m | 12m | |
|---|---|---|---|---|---|
| US S&P 500 | SPY | -0.91% | 4.12% | 9.57% | 12.7% |
| US NASDAQ 100 | QQQ | -2.30% | 4.10% | 9.33% | 12.0% |
| US Dow Jones Industrial 30 | DIA | 0.48% | 5.06% | 9.19% | 16.2% |
| German DAX 40 | DAX | -1.23% | 2.76% | -8.82% | 0.83% |
| Shanghai Shenzhen CSI 300 | CSI 300 | 1.10% | 2.44% | 9.26% | 12.6% |
| Hongkong Hang Seng | HSI | -1.56% | 2.56% | 6.65% | 6.73% |
| India NIFTY 50 | INDA | 0.11% | -3.76% | 6.86% | 18.2% |
| Brasil Bovespa | EWZ | -3.09% | -2.75% | 5.83% | 29.0% |
XCSR vs. Sectors XCSR is Over or Underperforming
| Symbol | 1w | 1m | 6m | 12m | |
|---|---|---|---|---|---|
| Communication Services | XLC | -1.01% | 4.34% | 0.50% | 4.93% |
| Consumer Discretionary | XLY | -1.76% | 4.33% | 7.13% | 9.80% |
| Consumer Staples | XLP | 3.94% | -2.73% | 4.11% | 12.7% |
| Energy | XLE | 1.66% | 10.5% | 11.1% | 33.6% |
| Financial | XLF | -0.49% | 3.14% | 1.41% | 3.06% |
| Health Care | XLV | 1.54% | 5.98% | 11.8% | 23.1% |
| Industrial | XLI | -0.03% | 3.27% | 8.74% | 15.0% |
| Materials | XLB | -0.14% | 3.16% | 15.6% | 26.2% |
| Real Estate | XLRE | 2.59% | 2.29% | 11.6% | 7.60% |
| Technology | XLK | -3.58% | 4.96% | 14.6% | 17.8% |
| Utilities | XLU | 2.07% | -1.01% | 6.91% | 1.09% |
| Aerospace & Defense | XAR | -0.16% | -0.03% | -1.77% | -3.37% |
| Biotech | XBI | -3.59% | 8.28% | 21.4% | 25.7% |
| Homebuilder | XHB | -0.91% | 5.18% | 24.3% | 29.6% |
| Retail | XRT | -0.01% | 3.18% | 13.3% | 26.3% |