(ELT) Elektrotim - Performance 139.4% in 12m
Compare ELT with Indices, Sectors and Commodities and Bonds. Who performs better in which timeframe?
Performance Rating
90.77%
#2 in Group
Rel. Strength
97.70%
#185 in Universe
Total Return 12m
139.37%
#3 in Group
Total Return 5y
1345.78%
#2 in Group
P/E 11.3
27th Percentile in Group
P/E Forward -
(?) Percentile in Group
PEG -
(?) Percentile in Group
FCF Yield 2.13%
32th Percentile in Group
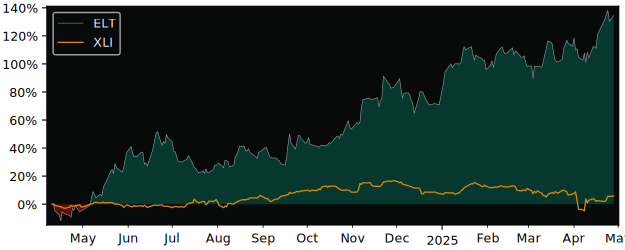
12m Total Return: ELT (139.4%) vs XLI (3.9%)
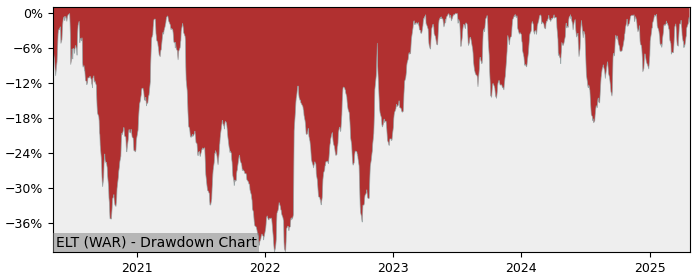
5y Drawdown (Underwater) Chart
Top Performers in Electrical Components & Equipment
Overall best picks of Peer Group Selected by proven GARP Predictive Metrics, sorted by Growth Rating
| Symbol | 1m | 12m | 5y | P/E | P/E Forward | PEG | EPS Stability |
EPS CAGR |
|---|---|---|---|---|---|---|---|---|
| RBC NYSE RBC Bearings |
-7.66% | 27.9% | 177% | 42.4 | 14.5 | 1.45 | 91.3% | 17.7% |
| POWL NASDAQ Powell Industries |
-7.08% | 33.9% | 745% | 12.5 | 12.4 | 0.89 | 90.6% | 247% |
| LYTS NASDAQ LSI Industries |
-9.97% | 12.1% | 229% | 20.3 | 14.1 | 0.39 | 64.7% | 37.7% |
| ABBN SW ABB |
-14% | 2.32% | 199% | 22 | 18.4 | 1.93 | 47.4% | 20.7% |
| AYI NYSE Acuity Brands |
-14.5% | -9.17% | 181% | 18.2 | 14.3 | 1.32 | 74.6% | 7.72% |
| HUBB NYSE Hubbell |
-1.53% | -13.4% | 218% | 22 | 17.9 | 1.8 | 87.6% | 26.6% |
| EMR NYSE Emerson Electric |
-13.1% | -9.9% | 117% | 26.6 | 17.1 | 1.35 | -14.1% | 2.34% |
| VRT NYSE Vertiv Holdings |
-19.5% | -12.9% | 601% | 56.9 | 22.1 | 0.63 | 57.4% | 43.4% |
Performance Comparison: ELT vs XLI vs S&P 500
XLI (Industrial Sector SPDR ETF) is the Sector Benchmark for ELT
| Total Return (including Dividends) | ELT | XLI | S&P 500 |
|---|---|---|---|
| 1 Month | -1.68% | -5.97% | -7.04% |
| 3 Months | -0.64% | -8.71% | -10.88% |
| 12 Months | 139.37% | 3.89% | 5.72% |
| 5 Years | 1345.78% | 119.43% | 100.77% |
| Trend Score (consistency of price movement) | ELT | XLI | S&P 500 |
| 1 Month | 10.6% | -76.1% | -76.1% |
| 3 Months | 24.3% | -89.1% | -86.4% |
| 12 Months | 93.4% | 64.3% | 67.8% |
| 5 Years | 88.8% | 87.4% | 84.3% |
| Relative Strength (compared with Indexes) | Rank in Peer Group | vs. XLI | vs. S&P 500 |
| 1 Month | #18 | 4.56% | 5.76% |
| 3 Month | #15 | 8.84% | 11.5% |
| 12 Month | #2 | 130% | 126% |
| 5 Years | #3 | 559% | 620% |
FAQs
Does ELT Elektrotim outperforms the market?
Yes,
over the last 12 months ELT made 139.37%, while its related Sector, the Industrial Sector SPDR (XLI) made 3.89%.
Over the last 3 months ELT made -0.64%, while XLI made -8.71%.
Over the last 3 months ELT made -0.64%, while XLI made -8.71%.
Performance Comparison ELT vs Indeces and Sectors
ELT vs. Indices ELT is Over or Underperforming
| Symbol | 1w | 1m | 6m | 12m | |
|---|---|---|---|---|---|
| US S&P 500 | SPY | 9.13% | 5.36% | 55.8% | 134% |
| US NASDAQ 100 | QQQ | 9.62% | 6.18% | 55.9% | 136% |
| US Dow Jones Industrial 30 | DIA | 7.23% | 3.49% | 53.8% | 133% |
| German DAX 40 | DAX | -3.37% | 6.37% | 37.2% | 120% |
| Shanghai Shenzhen CSI 300 | CSI 300 | 2.13% | 6.07% | 50.9% | 131% |
| Hongkong Hang Seng | HSI | 1.46% | 9.47% | 54.4% | 123% |
| India NIFTY 50 | INDA | 5.12% | -5.10% | 56.4% | 139% |
| Brasil Bovespa | EWZ | 4.62% | 4.60% | 55.5% | 150% |
ELT vs. Sectors ELT is Over or Underperforming
| Symbol | 1w | 1m | 6m | 12m | |
|---|---|---|---|---|---|
| Communication Services | XLC | 9.32% | 5.90% | 47.6% | 126% |
| Consumer Discretionary | XLY | 10.7% | 4.54% | 53.6% | 132% |
| Consumer Staples | XLP | 3.87% | -1.57% | 48.1% | 127% |
| Energy | XLE | 8.17% | 10.2% | 56.8% | 152% |
| Financial | XLF | 6.42% | 3.19% | 47.9% | 120% |
| Health Care | XLV | 6.72% | 5.10% | 57.0% | 140% |
| Industrial | XLI | 6.63% | 4.29% | 56.4% | 135% |
| Materials | XLB | 5.63% | 5.76% | 63.2% | 147% |
| Real Estate | XLRE | 3.38% | 3.31% | 56.1% | 125% |
| Technology | XLK | 9.82% | 8.15% | 61.8% | 143% |
| Utilities | XLU | 3.61% | 0.43% | 51.5% | 113% |
| Aerospace & Defense | XAR | 4.47% | -1.07% | 46.4% | 116% |
| Biotech | XBI | 4.61% | 13.2% | 71.7% | 151% |
| Homebuilder | XHB | 9.74% | 7.53% | 75.2% | 151% |
| Retail | XRT | 9.37% | 4.07% | 63.1% | 146% |