(TKA) thyssenkrupp - Performance 118.9% in 12m
Compare TKA with Indices, Sectors and Commodities and Bonds. Who performs better in which timeframe?
Performance Rating
12.27%
#99 in Group
Rel. Strength
96.94%
#246 in Universe
Total Return 12m
118.86%
#9 in Group
Total Return 5y
77.54%
#70 in Group
P/E -
(?) Percentile in Group
P/E Forward 13.8
36th Percentile in Group
PEG 136
99th Percentile in Group
FCF Yield 18.9%
25th Percentile in Group
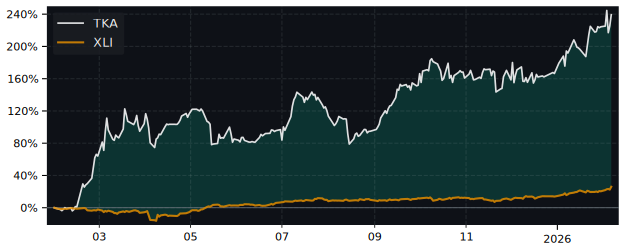
12m Total Return: TKA (118.9%) vs XLI (4.1%)
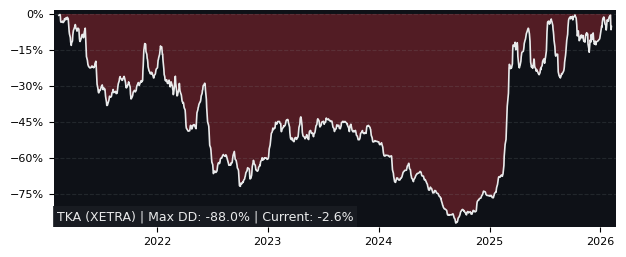
5y Drawdown (Underwater) Chart
Top Performers in Industrial Machinery & Supplies & Components
Overall best picks of Peer Group Selected by proven GARP Predictive Metrics, sorted by Growth Rating
| Symbol | 1m | 12m | 5y | P/E | P/E Forward | PEG | EPS Stability |
EPS CAGR |
|---|---|---|---|---|---|---|---|---|
| NPO NYSE Enpro Industries |
-19.2% | -3.21% | 251% | 41 | 18.6 | 1.74 | -47.6% | -6.67% |
| SIE XETRA Siemens Aktiengesellschaft |
-12.8% | 14.7% | 205% | 20.1 | 16.5 | 1.94 | 63.8% | 28.5% |
| G1A XETRA GEA |
-6.7% | 47.1% | 194% | 22.5 | 18.1 | 1.85 | 63.9% | 13.3% |
| MWA NYSE Mueller Water Products |
-7.13% | 61.3% | 196% | 28.2 | 19.9 | 1.33 | 28.3% | 14.1% |
| SXI NYSE Standex International |
-20.6% | -21.5% | 201% | 31.2 | 15.8 | 0.95 | 34.8% | -12.6% |
| EPAC NYSE Enerpac Tool |
-9.94% | 8.51% | 138% | 23.1 | 22.1 | 0.34 | 86.1% | 8.64% |
| SU PA Schneider Electric S.E. |
-9.94% | 1.4% | 181% | 26.5 | 19.8 | 1.61 | 76.3% | 37% |
| ITT NYSE ITT |
-5.43% | 3.07% | 168% | 18.1 | 17.8 | 1.8 | 82.9% | 11.9% |
Performance Comparison: TKA vs XLI vs S&P 500
XLI (Industrial Sector SPDR ETF) is the Sector Benchmark for TKA
| Total Return (including Dividends) | TKA | XLI | S&P 500 |
|---|---|---|---|
| 1 Month | 1.15% | -6.03% | -6.73% |
| 3 Months | 125.65% | -10.65% | -11.93% |
| 12 Months | 118.86% | 4.06% | 7.24% |
| 5 Years | 77.54% | 116.28% | 100.61% |
| Trend Score (consistency of price movement) | TKA | XLI | S&P 500 |
| 1 Month | -17.3% | -61.2% | -63.5% |
| 3 Months | 83.8% | -90.5% | -90.3% |
| 12 Months | 35.7% | 59.6% | 60.6% |
| 5 Years | -43.0% | 87.3% | 84.2% |
| Relative Strength (compared with Indexes) | Rank in Peer Group | vs. XLI | vs. S&P 500 |
| 1 Month | #19 | 7.64% | 8.45% |
| 3 Month | #2 | 153% | 156% |
| 12 Month | #9 | 110% | 104% |
| 5 Years | #76 | -17.9% | -11.5% |
FAQs
Does TKA thyssenkrupp outperforms the market?
Yes,
over the last 12 months TKA made 118.86%, while its related Sector, the Industrial Sector SPDR (XLI) made 4.06%.
Over the last 3 months TKA made 125.65%, while XLI made -10.65%.
Over the last 3 months TKA made 125.65%, while XLI made -10.65%.
Performance Comparison TKA vs Indeces and Sectors
TKA vs. Indices TKA is Over or Underperforming
| Symbol | 1w | 1m | 6m | 12m | |
|---|---|---|---|---|---|
| US S&P 500 | SPY | -0.67% | 7.88% | 213% | 112% |
| US NASDAQ 100 | QQQ | -1.15% | 8.51% | 213% | 111% |
| US Dow Jones Industrial 30 | DIA | 1.36% | 8.06% | 213% | 114% |
| German DAX 40 | DAX | -1.89% | 5.09% | 193% | 98.5% |
| Shanghai Shenzhen CSI 300 | CSI 300 | -0.10% | 4.54% | 212% | 110% |
| Hongkong Hang Seng | HSI | -3.34% | 4.87% | 209% | 102% |
| India NIFTY 50 | INDA | -2.82% | -0.88% | 210% | 116% |
| Brasil Bovespa | EWZ | -4.94% | 0.69% | 208% | 128% |
TKA vs. Sectors TKA is Over or Underperforming
| Symbol | 1w | 1m | 6m | 12m | |
|---|---|---|---|---|---|
| Communication Services | XLC | -1.38% | 8.0% | 204% | 104% |
| Consumer Discretionary | XLY | -2.11% | 7.99% | 208% | 108% |
| Consumer Staples | XLP | -0.82% | -1.83% | 205% | 108% |
| Energy | XLE | -0.74% | 13.7% | 215% | 132% |
| Financial | XLF | -1.37% | 6.0% | 205% | 101% |
| Health Care | XLV | 1.60% | 8.91% | 216% | 121% |
| Industrial | XLI | -0.07% | 7.18% | 214% | 115% |
| Materials | XLB | -0.41% | 7.0% | 221% | 125% |
| Real Estate | XLRE | -0.44% | 4.38% | 214% | 104% |
| Technology | XLK | -0.94% | 10.2% | 220% | 118% |
| Utilities | XLU | -0.56% | 0.95% | 210% | 97.2% |
| Aerospace & Defense | XAR | 0.78% | 4.33% | 204% | 97.0% |
| Biotech | XBI | -4.09% | 12.1% | 225% | 125% |
| Homebuilder | XHB | -2.20% | 9.27% | 228% | 129% |
| Retail | XRT | -2.54% | 6.54% | 217% | 125% |