(VFEA) Vanguard FTSE Emerging - Performance 13.3% in 12m
Compare VFEA with Indices, Sectors and Commodities and Bonds. Who performs better in which timeframe?
Performance Rating
51.60%
#16 in Group
Rel. Strength 12m
70.74%
#2293 in Universe
Total Return 12m
13.28%
#6 in Group
Total Return 5y
62.05%
#11 in Group
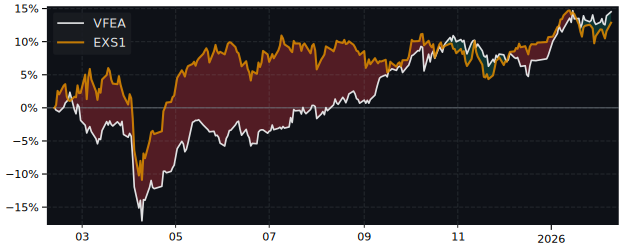
12m Total Return: VFEA (13.3%) vs EXS1 (24.8%)
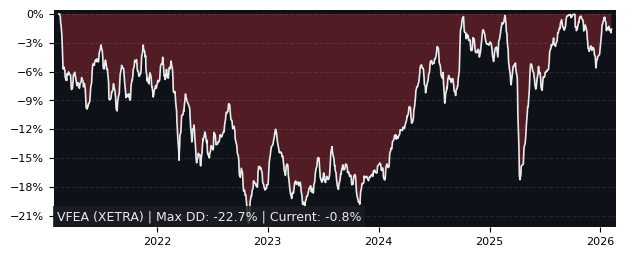
5y Drawdown (Underwater) Chart
Top Performers in Global Emerging Markets Equity
Overall best picks of Peer Group (based on Performance, Valuations and Relative Strength)
| Symbol | 1m | 12m | 5y | P/E | P/B | Growth Rating |
|---|---|---|---|---|---|---|
| 5MVL XETRA iShares Edge MSCI EM Value |
-4.0% | 14.4% | 89.7% | - | - | 71.60 |
| EMXC XETRA Amundi MSCI Emerging Ex |
-8.0% | -1.54% | 79.3% | - | - | 63.44 |
| IBC3 XETRA iShares Core MSCI EM IMI |
-4.73% | 8.29% | 64.4% | - | - | 53.42 |
| VFEM XETRA Vanguard FTSE Emerging |
-4.53% | 13.5% | 64.4% | - | - | 52.71 |
| IS3N XETRA iShares Core MSCI Emerging |
-4.81% | 8.02% | 63.1% | - | - | 52.01 |
Performance Duell VFEA vs EXS1
| Total Return (including Dividends) | VFEA | EXS1 | S&P 500 |
|---|---|---|---|
| 1 Month | -4.33% | -0.27% | -9.56% |
| 3 Months | -3.21% | 10.48% | -8.43% |
| 12 Months | 13.28% | 24.82% | 8.24% |
| 5 Years | 62.05% | 148.75% | 147.98% |
| Relative Strength (compared with Indexes) | Rank in Peer Group | vs. EXS1 | vs. S&P 500 |
| 1 Month | #38 | -4.07% | 5.79% |
| 3 Month | #58 | -12.4% | 5.70% |
| 12 Month | #33 | -9.24% | 4.66% |
| 5 Years | #45 | -34.9% | -34.7% |
| Trend Score (consistency of price movement) | VFEA | EXS1 | S&P 500 |
| 1 Month | -82.1% | 20% | -95.3% |
| 3 Months | 9.6% | 92% | -17.6% |
| 12 Months | 84% | 87.9% | 91.5% |
| 5 Years | 37.4% | 79% | 84.5% |
FAQs
Does VFEA Vanguard FTSE Emerging outperforms the market?
No,
over the last 12 months VFEA made 13.28%, while its related Sector, the iShares Core DAX (DE) EUR (EXS1) made 24.82%.
Over the last 3 months VFEA made -3.21%, while EXS1 made 10.48%.
Over the last 3 months VFEA made -3.21%, while EXS1 made 10.48%.
Performance Comparison VFEA vs Indeces and Sectors
VFEA vs. Indices VFEA is Over or Underperforming
| Symbol | 1w | 1m | 6m | 12m | |
|---|---|---|---|---|---|
| US S&P 500 | SPY | 1.72% | 5.23% | 8.64% | 5.04% |
| US NASDAQ 100 | QQQ | 2.07% | 8.28% | 8.57% | 6.27% |
| US Dow Jones Industrial 30 | DIA | 2.02% | 4.14% | 8.02% | 7.04% |
| German DAX 40 | DAX | 1.39% | -4.06% | -13.1% | -11.5% |
| Shanghai Shenzhen CSI 300 | CSI 300 | -0.86% | -5.38% | -13.9% | 2.58% |
| Hongkong Hang Seng | HSI | -1.07% | -12.3% | -8.80% | 0.78% |
| India NIFTY 50 | INDA | -1.12% | -0.60% | 22.9% | 16.4% |
| Brasil Bovespa | EWZ | -2.94% | -1.74% | 19.9% | 31.3% |
VFEA vs. Sectors VFEA is Over or Underperforming
| Symbol | 1w | 1m | 6m | 12m | |
|---|---|---|---|---|---|
| Communication Services | XLC | 2.83% | 5.06% | -2.40% | -6.16% |
| Consumer Discretionary | XLY | 4.53% | 10.9% | 6.93% | 5.98% |
| Consumer Staples | XLP | 1.95% | -1.76% | 11.7% | 6.18% |
| Energy | XLE | -3.42% | -1.51% | 3.83% | 13.6% |
| Financial | XLF | 1.97% | 3.95% | 0.01% | -3.74% |
| Health Care | XLV | 1.64% | -2.58% | 14.5% | 13.5% |
| Industrial | XLI | 0.95% | 2.28% | 7.94% | 6.62% |
| Materials | XLB | 1.09% | 1.54% | 14.9% | 18.6% |
| Real Estate | XLRE | 1.72% | -0.61% | 15.9% | 7.05% |
| Technology | XLK | 1.60% | 8.84% | 12.9% | 13.1% |
| Utilities | XLU | -3.95% | -1.72% | 7.40% | -11.7% |
| Aerospace & Defense | XAR | -0.74% | 2.36% | 3.19% | -1.83% |
| Biotech | XBI | -0.75% | 0.96% | 22.4% | 24.6% |
| Homebuilder | XHB | 3.86% | 5.54% | 27.3% | 23.4% |
| Retail | XRT | 4.10% | 11.9% | 18.4% | 24.2% |