(VH2) Friedrich Vorwerk SE - Performance 238.8% in 12m
Compare VH2 with Indices, Sectors and Commodities and Bonds. Who performs better in which timeframe?
Performance Rating
13.44%
#64 in Group
Rel. Strength
99.36%
#51 in Universe
Total Return 12m
238.83%
#2 in Group
Total Return 5y
17.30%
#65 in Group
P/E 41.6
92th Percentile in Group
P/E Forward -
(?) Percentile in Group
PEG -
(?) Percentile in Group
FCF Yield 4.33%
41th Percentile in Group
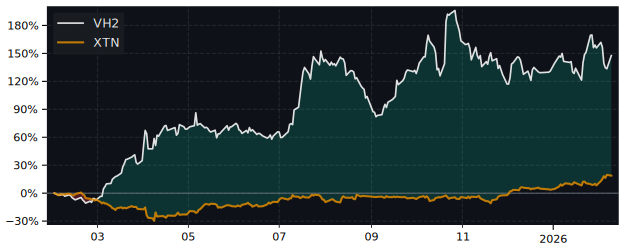
12m Total Return: VH2 (238.8%) vs XLE (-16.5%)
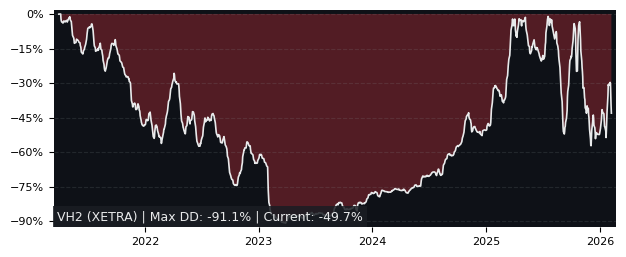
5y Drawdown (Underwater) Chart
Top Performers in Oil & Gas Storage & Transportation
Overall best picks of Peer Group Selected by proven GARP Predictive Metrics, sorted by Growth Rating
| Symbol | 1m | 12m | 5y | P/E | P/E Forward | PEG | EPS Stability |
EPS CAGR |
|---|---|---|---|---|---|---|---|---|
| MPLX NYSE MPLX |
-7.34% | 25.3% | 581% | 11.5 | 10.5 | 1.9 | 81.4% | 11.3% |
| TRGP NYSE Targa Resources |
-11.4% | 41.8% | 2374% | 31.5 | 22.7 | 0.95 | 63.3% | 31.6% |
| AM NYSE Antero Midstream Partners |
0.25% | 22.2% | 1029% | 21.7 | 18.7 | 1.17 | 77.9% | 7.85% |
| ET NYSE Energy Transfer |
-8.7% | 10.1% | 358% | 12.6 | 10.7 | 0.79 | 11.1% | -28.9% |
| ALA TO AltaGas |
3.53% | 31.4% | 251% | 20.1 | 17.3 | 1.92 | -6.50% | -31.7% |
| HESM NYSE Hess Midstream Partners |
-6.44% | 11.2% | 402% | 17 | 12.2 | 1.57 | 16.2% | 15.8% |
| KEY TO Keyera |
6.58% | 27% | 348% | 21 | 20.6 | 1.32 | 30.0% | 44.7% |
| OKE NYSE ONEOK |
-9.9% | 5.77% | 391% | 17.9 | 16.1 | 1.59 | 87.0% | 16.2% |
Performance Comparison: VH2 vs XLE vs S&P 500
XLE (Energy Sector SPDR Fund ETF) is the Sector Benchmark for VH2
| Total Return (including Dividends) | VH2 | XLE | S&P 500 |
|---|---|---|---|
| 1 Month | 37.89% | -7.66% | -11.51% |
| 3 Months | 78.53% | -8.84% | -14.88% |
| 12 Months | 238.83% | -16.53% | -1.35% |
| 5 Years | 17.30% | 208.13% | 105.18% |
| Trend Score (consistency of price movement) | VH2 | XLE | S&P 500 |
| 1 Month | 90.3% | 47% | -8.8% |
| 3 Months | 74.1% | 17% | -65.3% |
| 12 Months | 97.2% | -4% | 80.7% |
| 5 Years | -43.6% | 95.5% | 84.4% |
| Relative Strength (compared with Indexes) | Rank in Peer Group | vs. XLE | vs. S&P 500 |
| 1 Month | #2 | 49.3% | 55.8% |
| 3 Month | #2 | 95.8% | 110% |
| 12 Month | #2 | 306% | 243% |
| 5 Years | #58 | -37.1% | -14.5% |
FAQs
Does VH2 Friedrich Vorwerk SE outperforms the market?
Yes,
over the last 12 months VH2 made 238.83%, while its related Sector, the Energy Sector SPDR Fund (XLE) made -16.53%.
Over the last 3 months VH2 made 78.53%, while XLE made -8.84%.
Over the last 3 months VH2 made 78.53%, while XLE made -8.84%.
Performance Comparison VH2 vs Indeces and Sectors
VH2 vs. Indices VH2 is Over or Underperforming
| Symbol | 1w | 1m | 6m | 12m | |
|---|---|---|---|---|---|
| US S&P 500 | SPY | 19.1% | 49.4% | 125% | 240% |
| US NASDAQ 100 | QQQ | 19.3% | 51.2% | 127% | 242% |
| US Dow Jones Industrial 30 | DIA | 18.1% | 47.7% | 123% | 239% |
| German DAX 40 | DAX | 16.3% | 49.5% | 107% | 227% |
| Shanghai Shenzhen CSI 300 | CSI 300 | 14.5% | 45.3% | 143% | 234% |
| Hongkong Hang Seng | HSI | 15.8% | 48.6% | 133% | 229% |
| India NIFTY 50 | INDA | 13.8% | 37.4% | 126% | 244% |
| Brasil Bovespa | EWZ | 14.6% | 38.2% | 127% | 257% |
VH2 vs. Sectors VH2 is Over or Underperforming
| Symbol | 1w | 1m | 6m | 12m | |
|---|---|---|---|---|---|
| Communication Services | XLC | 19.0% | 50.1% | 117% | 232% |
| Consumer Discretionary | XLY | 16.8% | 48.9% | 121% | 237% |
| Consumer Staples | XLP | 13.3% | 42.4% | 116% | 230% |
| Energy | XLE | 25.1% | 45.6% | 129% | 255% |
| Financial | XLF | 20.7% | 48.1% | 116% | 231% |
| Health Care | XLV | 16.7% | 46.9% | 124% | 243% |
| Industrial | XLI | 19.4% | 48.7% | 127% | 243% |
| Materials | XLB | 18.8% | 48.5% | 132% | 253% |
| Real Estate | XLRE | 16.3% | 45.0% | 123% | 235% |
| Technology | XLK | 21.1% | 53.1% | 133% | 250% |
| Utilities | XLU | 14.9% | 39.0% | 119% | 222% |
| Aerospace & Defense | XAR | 19.2% | 47.6% | 123% | 233% |
| Biotech | XBI | 18.6% | 53.3% | 138% | 257% |
| Homebuilder | XHB | 13.6% | 46.1% | 138% | 253% |
| Retail | XRT | 15.5% | 46.2% | 128% | 251% |