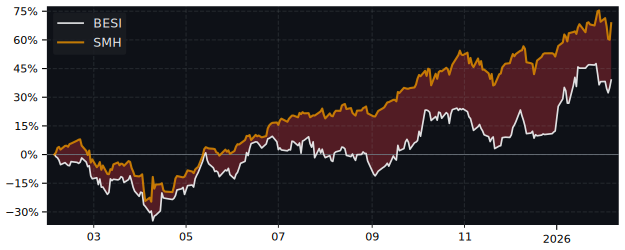
BESI Performance: 129.3% Return (12 Months)
BESI returned 129.3% over 12 months, outperforming the S&P 500 (32.1%). Volatility: 49.6%.
| P/E Trailing | 115 |
| P/E Forward | 59.2 |
| 52 Week High | 197.60 EUR |
| 52 Week Low | 77.81 EUR |
| VRO Trend Strength ±100 | 62.61 |
| Buy Signal ±3 | 0.20 |
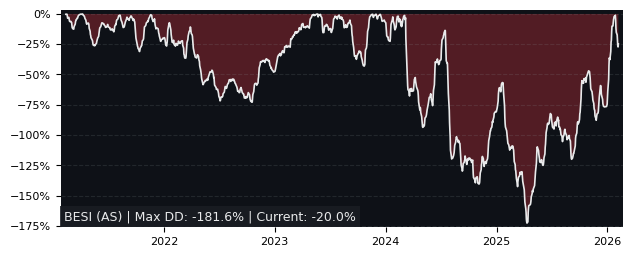
| Max Drawdown | 54.52% |
| Mean Drawdown | 19.45% |
Top Performer in Semiconductor Materials & Equipment (5/36)
| SYMBOL | 1W | 1M | 3M |
|---|---|---|---|
| ICHR | 13.39% | 19.34% | 109.57% |
| UCTT | 13.26% | 25.20% | 99.37% |
| SOI | -3.47% | 19.90% | 94.10% |
| INTT | 11.74% | 9.97% | 79.09% |
| FORM | 14.29% | 22.89% | 63.23% |
| BESI | 9.16% | 21.66% | 18.18% |
| SYMBOL | 6M | 12M | 5Y |
|---|---|---|---|
| MU | 97.98% | 453.85% | 306.48% |
| TER | 113.57% | 334.47% | 140.27% |
| FORM | 145.41% | 328.68% | 105.61% |
| AEIS | 88.71% | 306.04% | 185.18% |
| AIXA | 123.21% | 254.42% | 84.03% |
| BESI | 29.57% | 129.30% | 188.51% |
| SYMBOL | MCAP | 1M | 12M | 5Y | P/E | P/E fwd | PEG | EPS stab | EPS cagr |
|---|---|---|---|---|---|---|---|---|---|
| AMAT NASDAQ Applied Materials |
277B | 8.59% | 168% | 164% | 35.7 | 32.6 | 1.69 | 87.5% | 6.95% |
| CAMT NASDAQ Camtek |
7.34B | 8.02% | 188% | 386% | 152 | 46.5 | 3.11 | 94.7% | 17.7% |
| MU NASDAQ Micron Technology |
413B | 2.06% | 454% | 306% | 17.3 | 6.33 | 0.21 | 62.1% | 51.2% |
| LRCX NASDAQ Lam Research |
274B | 10.7% | 257% | 248% | 44.9 | 32.7 | 1.60 | -3.10% | -47.4% |
| TER NASDAQ Teradyne |
48.5B | 15.5% | 334% | 140% | 89.2 | 51.8 | 1.72 | -5.20% | 17.6% |
Performance: BESI vs S&P 500
| PERIOD | BESI | S&P 500 | DIFFERENCE |
|---|---|---|---|
| 1 Month | 21.66% | -1.73% | 24.39% |
| 3 Months | 18.18% | -4.49% | 24.32% |
| 6 Months | 29.57% | -1.33% | 31.94% |
| 12 Months | 129.30% | 32.14% | 74.34% |
| 5 Years | 188.51% | 72.70% | 67.84% |
BESI Performance FAQ
Does BESI outperform the market?
Yes, BESI significantly outperforms the market. Over the past 12 months, BESI returned 129.30% compared to 32.14% for the S&P 500.
What is the BESI return over the last 12 months?
BESI has returned 129.30% over the past 12 months, including dividends. Over 3 months the return was 18.18%, and over 5 years 188.51%.
How risky is BESI?
BESI has relatively low risk with a maximum drawdown of 54.52% over the past 3 years. The average drawdown is 19.45%.
BESI vs Sectors (12m)
Sorted by outperformance. Positive = BESI beats sector.
| SECTOR | ETF | DIFFERENCE 12M |
|---|---|---|
| Consumer Staples | XLP | 119.8% |
| Health Care | XLV | 118.6% |
| Real Estate | XLRE | 115.6% |
| Financials | XLF | 114.4% |
| Consumer Discretionary | XLY | 107.6% |
| Consumer Discretionary | XLY | 107.6% |
| Communication Services | XLC | 99.8% |
| Materials | XLB | 95.7% |
| Industrials | XLI | 87.2% |
| Technology | XLK | 79.3% |
| Energy | XLE | 71.9% |
BESI vs Asset Classes (12m)
| ASSET CLASS | ETF | DIFFERENCE 12M |
|---|---|---|
| S&P 500 | SPY | 74.34% |
| Gold | GLD | 73.1% |
| Long-Term Bonds | TLT | 128.7% |