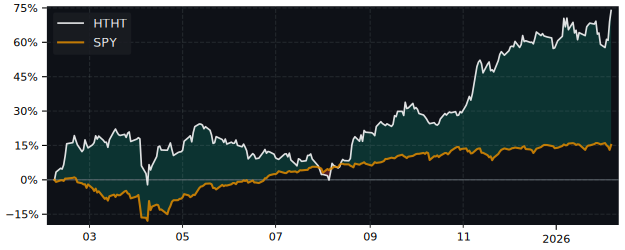
HTHT Performance: 48.3% Return (12 Months)
HTHT returned 48.3% over 12 months, outperforming the S&P 500 (23.6%). Volatility: 37.4%.
RS IBD
43.93
Top 16% in Peers
Volatility
37.4%
Top 39% in Peers
Total Return 12m
48.28%
Top 33% in Peers
RS Rating
83.26
Top 16% in Peers
P/E
| P/E Trailing | 22.2 |
| P/E Forward | 35.3 |
High / Low 52w
| 52 Week High | 56.06 USD |
| 52 Week Low | 29.22 USD |
Sentiment
| VRO Trend Strength ±100 | 24.38 |
| Buy Signal ±3 | 0.29 |
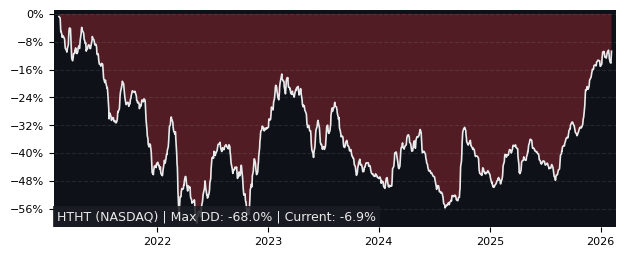
Drawdowns 3y
| Max Drawdown | 43.50% |
| Mean Drawdown | 21.51% |
Compare performance with 29 peers in Hotels, Resorts & Cruise Lines
12m Total Return: HTHT (48.3%) vs SPY (23.6%)
5y Drawdown (Underwater) Chart
Top Performer in Hotels, Resorts & Cruise Lines (5/29)
Short Term Performance
| SYMBOL | 1W | 1M | 3M |
|---|---|---|---|
| HTHT | 6.33% | -1.06% | 7.52% |
| TH | 44.43% | 82.15% | 70.73% |
| MEL | 5.40% | 27.61% | 23.27% |
| VAC | 1.98% | 0.37% | 14.51% |
| PRSU | 6.82% | 2.86% | 10.70% |
| WH | 3.44% | 2.09% | 7.10% |
Long Term Performance
| SYMBOL | 6M | 12M | 5Y |
|---|---|---|---|
| HTHT | 35.61% | 48.28% | 5.14% |
| TH | 75.47% | 106.55% | 433.85% |
| LIND | 36.70% | 98.37% | -9.11% |
| VIK | 24.01% | 95.10% | 186.59% |
| MEL | 32.71% | 58.51% | 52.77% |
| TNL | 17.14% | 72.50% | 35.44% |
Performance: HTHT vs S&P 500
| Total Return | HTHT | S&P 500 | Difference |
|---|---|---|---|
| 1 Month | -1.06% | -3.34% | 2.36% |
| 3 Months | 7.52% | -4.38% | 12.4% |
| 6 Months | 35.61% | -1.44% | 37.6% |
| 12 Months | 48.28% | 23.60% | 20.0% |
| 5 Years | 5.14% | 72.80% | -39.2% |
FAQs
Does HTHT outperform the market?
Yes, HTHT significantly outperforms the market.
Over the past 12 months, HTHT returned 48.28% compared to 23.60% for the S&P 500.
What is the HTHT return over the last 12 months?
HTHT has returned 48.28% over the past 12 months, including dividends.
Over 3 months the return was 7.52%, and over 5 years 5.14%.
How risky is HTHT?
HTHT has relatively low risk with a maximum drawdown of 43.50% over the past 3 years.
The average drawdown is 21.51%.
HTHT vs Sectors (12m)
Sorted by outperformance. Positive = HTHT beats sector.
| Sector | ETF | Difference |
|---|---|---|
| Consumer Staples | XLP | 45.7% |
| Health Care | XLV | 43.9% |
| Financials | XLF | 42.8% |
| Real Estate | XLRE | 42.8% |
| Consumer Discretionary | XLY | 34.2% |
| Consumer Discretionary | XLY | 34.2% |
| Communication Services | XLC | 26.1% |
| Materials | XLB | 24.6% |
| Industrials | XLI | 16.4% |
| Technology | XLK | 8.17% |
| Energy | XLE | 7.28% |
HTHT vs Asset Classes (12m)
| Asset Class | ETF | Difference |
|---|---|---|
| S&P 500 | SPY | 20.0% |
| Gold | GLD | -1.64% |
| Long-Term Bonds | TLT | 49.5% |