(RGC) Regencell Bioscience - Performance 347.2% in 12m
Compare RGC with Indices, Sectors and Commodities and Bonds. Who performs better in which timeframe?
Performance Rating
14.66%
#29 in Group
Rel. Strength
99.57%
#35 in Universe
Total Return 12m
347.20%
#3 in Group
Total Return 5y
174.29%
#12 in Group
P/E -
(?) Percentile in Group
P/E Forward -
(?) Percentile in Group
PEG -
(?) Percentile in Group
FCF Yield 0.41%
(?) Percentile in Group
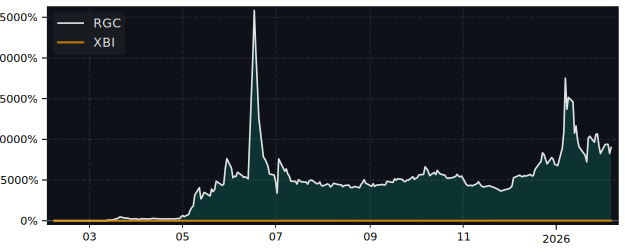
12m Total Return: RGC (347.2%) vs XBI (-7.2%)
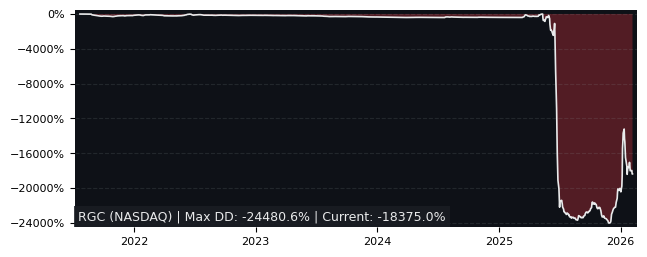
5y Drawdown (Underwater) Chart
Top Performers in Biotechnology
Overall best picks of Peer Group Selected by proven GARP Predictive Metrics, sorted by Growth Rating
| Symbol | 1m | 12m | 5y | P/E | P/E Forward | PEG | EPS Stability |
EPS CAGR |
|---|---|---|---|---|---|---|---|---|
| UTHR NASDAQ United Therapeutics |
-8.45% | 25.1% | 163% | 11.8 | 10.6 | 1.43 | 83.8% | 78.5% |
| HLN NYSE Haleon |
3.06% | 25.7% | 43.7% | 24.7 | 20.3 | 1.8 | 27.1% | - |
| AMGN NASDAQ Amgen |
-11.4% | 5.51% | 37.4% | 36.6 | 13.3 | 0.94 | -18.8% | -20% |
| LONN SW Lonza |
-3.34% | 9.2% | 33.3% | 60.7 | 31.7 | 1.15 | 12.6% | -10.3% |
| BIM PA Biomerieux |
-3.25% | 13.2% | -1.03% | 31 | 24.2 | 1.45 | -58.7% | -25.1% |
| NBIX NASDAQ Neurocrine Biosciences |
-12% | -23.9% | 3.63% | 30.8 | 20.4 | 0.27 | 61.5% | 31.6% |
| KMDA NASDAQ Kamada |
-8.87% | 30.5% | -10.1% | 24.3 | 22.8 | 0.91 | 47.7% | 3.93% |
| ERF PA Eurofins Scientific SE |
-2.43% | -17.2% | 17.1% | 24.3 | 11.7 | 0.58 | -70.8% | -17.1% |
Performance Comparison: RGC vs XBI vs S&P 500
XBI (SPDR S&P Biotech ETF) is the Sector Benchmark for RGC
| Total Return (including Dividends) | RGC | XBI | S&P 500 |
|---|---|---|---|
| 1 Month | -29.76% | -12.59% | -8.16% |
| 3 Months | 480.66% | -14.87% | -12.80% |
| 12 Months | 347.20% | -7.16% | 6.85% |
| 5 Years | 174.29% | -19.64% | 100.40% |
| Trend Score (consistency of price movement) | RGC | XBI | S&P 500 |
| 1 Month | -30.8% | -66.6% | -70.9% |
| 3 Months | 77.1% | -92.4% | -90.1% |
| 12 Months | 17.7% | -30.3% | 62.2% |
| 5 Years | -63.3% | -53.2% | 84.2% |
| Relative Strength (compared with Indexes) | Rank in Peer Group | vs. XBI | vs. S&P 500 |
| 1 Month | #173 | -19.6% | -23.5% |
| 3 Month | #2 | 582% | 566% |
| 12 Month | #4 | 382% | 319% |
| 5 Years | #9 | 344% | 113% |
FAQs
Does RGC Regencell Bioscience outperforms the market?
Yes,
over the last 12 months RGC made 347.20%, while its related Sector, the SPDR S&P Biotech (XBI) made -7.16%.
Over the last 3 months RGC made 480.66%, while XBI made -14.87%.
Over the last 3 months RGC made 480.66%, while XBI made -14.87%.
Performance Comparison RGC vs Indeces and Sectors
RGC vs. Indices RGC is Over or Underperforming
| Symbol | 1w | 1m | 6m | 12m | |
|---|---|---|---|---|---|
| US S&P 500 | SPY | -8.85% | -21.6% | 480% | 340% |
| US NASDAQ 100 | QQQ | -7.83% | -20.4% | 482% | 340% |
| US Dow Jones Industrial 30 | DIA | -7.90% | -21.9% | 479% | 343% |
| German DAX 40 | DAX | -10.9% | -22.9% | 462% | 329% |
| Shanghai Shenzhen CSI 300 | CSI 300 | -12.5% | -26.0% | 478% | 339% |
| Hongkong Hang Seng | HSI | -13.9% | -24.8% | 476% | 330% |
| India NIFTY 50 | INDA | -15.4% | -32.4% | 474% | 343% |
| Brasil Bovespa | EWZ | -14.8% | -28.5% | 475% | 357% |
RGC vs. Sectors RGC is Over or Underperforming
| Symbol | 1w | 1m | 6m | 12m | |
|---|---|---|---|---|---|
| Communication Services | XLC | -9.01% | -21.4% | 471% | 332% |
| Consumer Discretionary | XLY | -9.33% | -20.9% | 477% | 337% |
| Consumer Staples | XLP | -12.3% | -33.3% | 470% | 335% |
| Energy | XLE | -13.7% | -17.4% | 480% | 359% |
| Financial | XLF | -10.6% | -23.8% | 471% | 330% |
| Health Care | XLV | -8.87% | -21.5% | 481% | 349% |
| Industrial | XLI | -9.42% | -22.6% | 480% | 343% |
| Materials | XLB | -11.5% | -23.8% | 486% | 354% |
| Real Estate | XLRE | -12.2% | -26.4% | 478% | 332% |
| Technology | XLK | -6.58% | -18.2% | 488% | 347% |
| Utilities | XLU | -11.2% | -29.5% | 474% | 325% |
| Aerospace & Defense | XAR | -8.49% | -24.4% | 472% | 326% |
| Biotech | XBI | -12.2% | -17.2% | 492% | 354% |
| Homebuilder | XHB | -12.0% | -21.8% | 493% | 355% |
| Retail | XRT | -13.1% | -24.1% | 482% | 352% |