(TERN) Terns Pharmaceuticals - Performance -52.6% in 12m
Compare TERN with Indices, Sectors and Commodities and Bonds. Who performs better in which timeframe?
Performance Rating
-56.84%
#115 in Group
Rel. Strength 12m
10.03%
#7042 in Universe
Total Return 12m
-52.61%
#153 in Group
Total Return 5y
-82.71%
#139 in Group
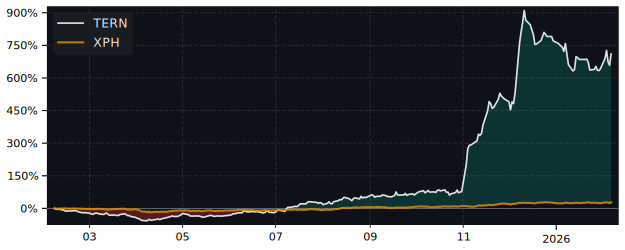
12m Total Return: TERN (-52.6%) vs XLV (0.9%)
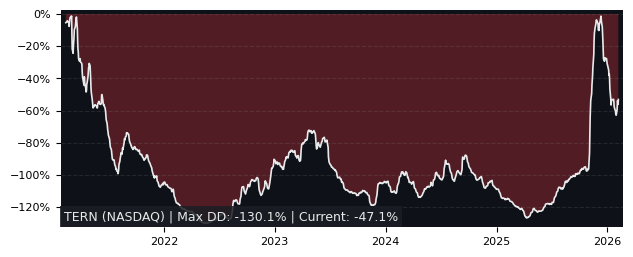
5y Drawdown (Underwater) Chart
Top Performers in Pharmaceuticals
Overall best picks of Peer Group (based on Performance, Valuations and Relative Strength)
| Symbol | 1m | 12m | 5y | P/E | P/B | Growth Rating |
|---|---|---|---|---|---|---|
| CPH TO Cipher Pharmaceuticals |
-12.0% | 59.2% | 2,125% | 12.84 | 2.36 | 90.59 |
| PBH NYSE Prestige Brand Holdings |
-2.69% | 13.1% | 176% | 20.90 | 2.41 | 88.84 |
| NVS NYSE Novartis |
7.17% | 15.1% | 93.0% | 19.67 | 5.18 | 67.99 |
| NOVN SW Novartis |
4.64% | 15.0% | 76.8% | 19.33 | 5.01 | 64.74 |
| RDY NYSE Dr. Reddy’s Laboratories |
-6.76% | -10.8% | 108% | 17.18 | 2.90 | 53.55 |
Performance Duell TERN vs XLV
| Total Return (including Dividends) | TERN | XLV | S&P 500 |
|---|---|---|---|
| 1 Month | -21.67% | 0.09% | -7.69% |
| 3 Months | -54.44% | 4.51% | -6.94% |
| 12 Months | -52.61% | 0.88% | 10.70% |
| 5 Years | -82.71% | 92.03% | 153.10% |
| Relative Strength (compared with Indexes) | Rank in Peer Group | vs. XLV | vs. S&P 500 |
| 1 Month | #161 | -21.8% | -15.2% |
| 3 Month | #182 | -56.4% | -51.1% |
| 12 Month | #152 | -53.0% | -57.2% |
| 5 Years | #131 | -87.0% | -88.8% |
| Trend Score (consistency of price movement) | TERN | XLV | S&P 500 |
| 1 Month | -89.7% | 8.1% | -96% |
| 3 Months | -96.5% | 81.6% | -21% |
| 12 Months | -31.9% | 23.2% | 91% |
| 5 Years | -30.7% | 90.5% | 84.5% |
FAQs
Does TERN Terns Pharmaceuticals outperforms the market?
No,
over the last 12 months TERN made -52.61%, while its related Sector, the Health Care Sector SPDR (XLV) made 0.88%.
Over the last 3 months TERN made -54.44%, while XLV made 4.51%.
Over the last 3 months TERN made -54.44%, while XLV made 4.51%.
Performance Comparison TERN vs Indeces and Sectors
TERN vs. Indices TERN is Over or Underperforming
| Symbol | 1w | 1m | 6m | 12m | |
|---|---|---|---|---|---|
| US S&P 500 | SPY | -6.60% | -14.0% | -66.9% | -63.3% |
| US NASDAQ 100 | QQQ | -6.41% | -10.8% | -67.9% | -62.5% |
| US Dow Jones Industrial 30 | DIA | -5.87% | -15.0% | -66.6% | -60.9% |
| German DAX 40 | DAX | -8.87% | -23.9% | -89.5% | -80.1% |
| Shanghai Shenzhen CSI 300 | CSI 300 | -12.1% | -24.4% | -91.4% | -68.0% |
| Hongkong Hang Seng | HSI | -8.01% | -28.6% | -81.6% | -67.1% |
| India NIFTY 50 | INDA | -8.53% | -20.3% | -51.0% | -49.8% |
| Brasil Bovespa | EWZ | -13.0% | -19.7% | -56.3% | -38.8% |
TERN vs. Sectors TERN is Over or Underperforming
| Symbol | 1w | 1m | 6m | 12m | |
|---|---|---|---|---|---|
| Communication Services | XLC | -5.18% | -13.4% | -76.9% | -74.5% |
| Consumer Discretionary | XLY | -4.52% | -8.32% | -69.0% | -62.9% |
| Consumer Staples | XLP | -4.84% | -20.3% | -61.8% | -60.8% |
| Energy | XLE | -11.5% | -21.3% | -71.6% | -54.2% |
| Financial | XLF | -7.66% | -15.3% | -74.7% | -73.3% |
| Health Care | XLV | -5.97% | -21.8% | -59.1% | -53.5% |
| Industrial | XLI | -6.56% | -17.0% | -67.0% | -61.7% |
| Materials | XLB | -6.78% | -17.4% | -59.0% | -49.1% |
| Real Estate | XLRE | -6.48% | -20.2% | -59.2% | -62.5% |
| Technology | XLK | -6.78% | -10.8% | -64.0% | -55.8% |
| Utilities | XLU | -10.9% | -21.4% | -67.4% | -81.0% |
| Aerospace & Defense | XAR | -9.39% | -17.5% | -72.7% | -71.2% |
| Biotech | XBI | -8.69% | -17.0% | -52.3% | -45.0% |
| Homebuilder | XHB | -4.59% | -13.1% | -47.4% | -46.1% |
| Retail | XRT | -3.01% | -6.76% | -56.3% | -43.7% |