GL Performance: 25.8% Return (12 Months)
GL returned 25.8% over 12 months, underperforming the S&P 500 (31.5%). Volatility: 23.9%.
RS IBD
12.32
Top 22% in Peers
Volatility
23.9%
Top 50% in Peers
Total Return 12m
25.79%
Top 31% in Peers
RS Rating
58.30
Top 22% in Peers
P/E
| P/E Trailing | 10.1 |
| P/E Forward | 10.4 |
High / Low 52w
| 52 Week High | 146.60 USD |
| 52 Week Low | 112.33 USD |
Sentiment
| VRO Trend Strength ±100 | 64.14 |
| Buy Signal ±3 | 0.36 |
Drawdowns 3y
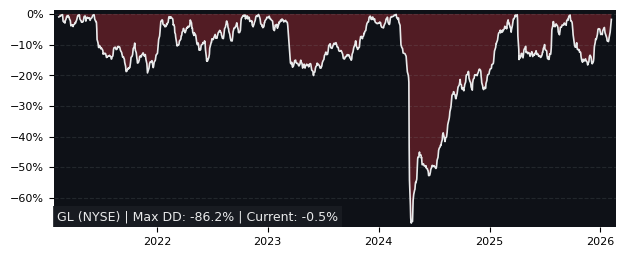
| Max Drawdown | 61.62% |
| Mean Drawdown | 9.47% |
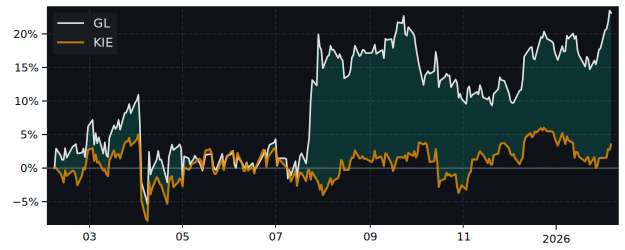
Compare performance with 21 peers in Life & Health Insurance
12m Total Return: GL (25.8%) vs SPY (31.5%)
5y Drawdown (Underwater) Chart
Top Performer in Life & Health Insurance (5/21)
Short Term Performance
| SYMBOL | 1W | 1M | 3M |
|---|---|---|---|
| NN | 4.91% | 4.82% | 3.79% |
| GL | 4.75% | -0.30% | 1.64% |
| SLF | 2.75% | -2.89% | 1.27% |
| AFL | 2.14% | -0.50% | -1.00% |
| MFC | 3.71% | 1.45% | -3.90% |
| FG | 4.91% | 12.31% | -9.86% |
Long Term Performance
| SYMBOL | 6M | 12M | 5Y |
|---|---|---|---|
| NN | 18.61% | 63.86% | 130.42% |
| PUK | 5.13% | 59.21% | -25.23% |
| PST | 5.28% | 47.09% | 160.27% |
| MFC | 10.11% | 32.44% | 103.05% |
| GL | 6.88% | 25.79% | 50.74% |
| BHF | 17.12% | 24.98% | 29.79% |
Overall Best Picks of Peer Group (GARP Metrics)
| SYMBOL | MCAP | 1M | 12M | 5Y | P/E | P/E fwd | PEG | EPS stab | EPS cagr |
|---|---|---|---|---|---|---|---|---|---|
| PST MI Poste Italiane SpA |
31.7B | -4.66% | 47.1% | 160% | 12.9 | - | - | 41.0% | 11.7% |
| PUK NYSE Prudential |
36.8B | -0.39% | 59.2% | -25.2% | 9.54 | 13.4 | 1.31 | -4.60% | -1.57% |
| GL NYSE Globe Life |
11.2B | -0.30% | 25.8% | 50.7% | 10.1 | 10.4 | 1.30 | 90.9% | 20.2% |
Performance: GL vs S&P 500
Total Return vs S&P 500
| PERIOD | GL | S&P 500 | DIFFERENCE |
|---|---|---|---|
| 1 Month | -0.30% | -3.48% | 3.29% |
| 3 Months | 1.64% | -4.38% | 6.29% |
| 6 Months | 6.88% | -1.79% | 8.83% |
| 12 Months | 25.79% | 31.52% | -4.36% |
| 5 Years | 50.74% | 72.80% | -12.77% |
GL Performance FAQ
Does GL outperform the market?
No, GL underperforms the market. Over the past 12 months, GL returned 25.79% compared to 31.52% for the S&P 500.
What is the GL return over the last 12 months?
GL has returned 25.79% over the past 12 months, including dividends. Over 3 months the return was 1.64%, and over 5 years 50.74%.
How risky is GL?
GL has relatively low risk with a maximum drawdown of 61.62% over the past 3 years. The average drawdown is 9.47%.
GL vs Sectors (12m)
Sorted by outperformance. Positive = GL beats sector.
Relative Performance vs S&P Sectors
| SECTOR | ETF | DIFFERENCE 12M |
|---|---|---|
| Consumer Staples | XLP | 17.3% |
| Health Care | XLV | 14.7% |
| Real Estate | XLRE | 12.5% |
| Financials | XLF | 11.7% |
| Consumer Discretionary | XLY | 5.1% |
| Communication Services | XLC | -3.7% |
| Communication Services | XLC | -3.7% |
| Materials | XLB | -8.4% |
| Industrials | XLI | -15.6% |
| Technology | XLK | -23.3% |
| Energy | XLE | -30.5% |
GL vs Asset Classes (12m)
Relative Performance vs Major Asset Classes
| ASSET CLASS | ETF | DIFFERENCE 12M |
|---|---|---|
| S&P 500 | SPY | -4.36% |
| Gold | GLD | -31.1% |
| Long-Term Bonds | TLT | 25% |