SQM Performance: 126.1% Return (12 Months)
SQM returned 126.1% over 12 months, outperforming the S&P 500 (32.2%). Volatility: 47.6%.
| P/E Trailing | 40.4 |
| P/E Forward | 16.3 |
| 52 Week High | 85.43 USD |
| 52 Week Low | 30.03 USD |
| VRO Trend Strength ±100 | 51.44 |
| Buy Signal ±3 | 0.09 |
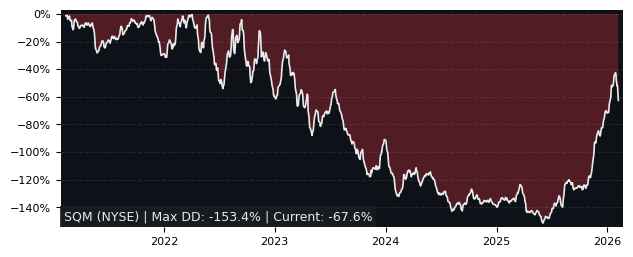
| Max Drawdown | 61.84% |
| Mean Drawdown | 36.55% |
Top Performer in Fertilizers & Agricultural Chemicals (5/12)
| SYMBOL | 1W | 1M | 3M |
|---|---|---|---|
| CF | 3.03% | 20.48% | 73.56% |
| IPI | -3.32% | -1.94% | 49.82% |
| SDF | 5.64% | 9.89% | 38.31% |
| UAN | 3.02% | 11.87% | 21.28% |
| FMC | 2.44% | 25.53% | 21.23% |
| SQM | -2.99% | 4.69% | 4.55% |
| SYMBOL | 6M | 12M | 5Y |
|---|---|---|---|
| SQM | 80.96% | 126.09% | 67.15% |
| UAN | 44.71% | 123.83% | 471.76% |
| CF | 47.11% | 90.02% | 223.68% |
| NTR | 28.82% | 67.46% | 65.47% |
| IPI | 36.20% | 62.92% | 32.40% |
| SDF | 46.68% | 40.72% | 137.02% |
| SYMBOL | MCAP | 1M | 12M | 5Y | P/E | P/E fwd | PEG | EPS stab | EPS cagr |
|---|---|---|---|---|---|---|---|---|---|
| CF NYSE CF Industries Holdings |
20.0B | 20.5% | 90.0% | 224% | 14.5 | 15.0 | 6.01 | -55.2% | -59.2% |
| NTR NYSE Nutrien |
36.5B | 2.15% | 67.5% | 65.5% | 16.2 | 15.2 | 0.58 | -56.3% | -67.3% |
Performance: SQM vs S&P 500
| PERIOD | SQM | S&P 500 | DIFFERENCE |
|---|---|---|---|
| 1 Month | 4.69% | -2.54% | 7.43% |
| 3 Months | 4.55% | -4.14% | 9.07% |
| 6 Months | 80.96% | -0.92% | 82.64% |
| 12 Months | 126.09% | 32.20% | 71.02% |
| 5 Years | 67.15% | 71.53% | -2.55% |
SQM Performance FAQ
Does SQM outperform the market?
Yes, SQM significantly outperforms the market. Over the past 12 months, SQM returned 126.09% compared to 32.20% for the S&P 500.
What is the SQM return over the last 12 months?
SQM has returned 126.09% over the past 12 months, including dividends. Over 3 months the return was 4.55%, and over 5 years 67.15%.
How risky is SQM?
SQM has relatively low risk with a maximum drawdown of 61.84% over the past 3 years. The average drawdown is 36.55%.
SQM vs Sectors (12m)
Sorted by outperformance. Positive = SQM beats sector.
| SECTOR | ETF | DIFFERENCE 12M |
|---|---|---|
| Consumer Staples | XLP | 118.4% |
| Health Care | XLV | 115.2% |
| Real Estate | XLRE | 112.5% |
| Financials | XLF | 111.2% |
| Consumer Discretionary | XLY | 105.8% |
| Communication Services | XLC | 96.5% |
| Communication Services | XLC | 96.5% |
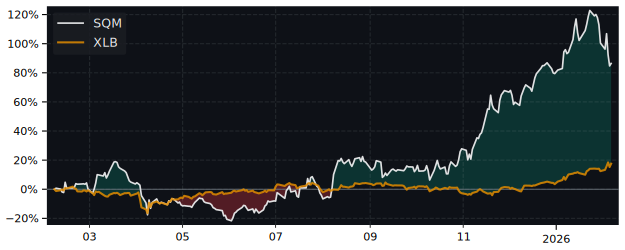
| Materials | XLB | 92.8% |
| Industrials | XLI | 84.3% |
| Technology | XLK | 75.4% |
| Energy | XLE | 67.4% |
SQM vs Asset Classes (12m)
| ASSET CLASS | ETF | DIFFERENCE 12M |
|---|---|---|
| S&P 500 | SPY | 71.02% |
| Gold | GLD | 68.3% |
| Long-Term Bonds | TLT | 125.5% |