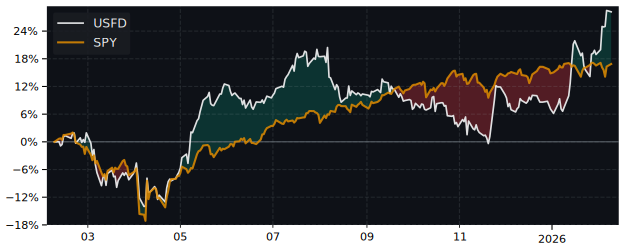
USFD Performance: 48.7% Return (12 Months)
USFD returned 48.7% over 12 months, outperforming the S&P 500 (31.5%). Volatility: 25.1%.
| P/E Trailing | 31.4 |
| P/E Forward | 19.5 |
| 52 Week High | 101.98 USD |
| 52 Week Low | 60.47 USD |
| VRO Trend Strength ±100 | 31.07 |
| Buy Signal ±3 | -0.13 |
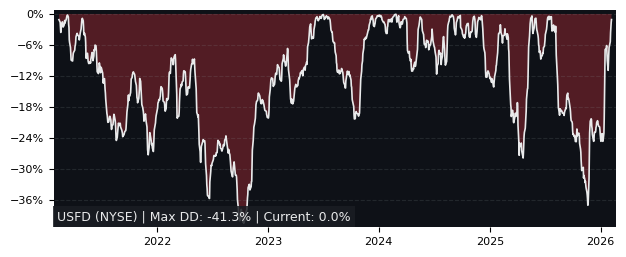
| Max Drawdown | 19.01% |
| Mean Drawdown | 4.98% |
Top Performer in Consumer Staples Distribution & Retail (5/32)
| SYMBOL | 1W | 1M | 3M |
|---|---|---|---|
| ANDE | 2.86% | 15.80% | 39.37% |
| UNFI | 0.49% | 18.53% | 34.78% |
| CASY | 5.48% | 10.81% | 31.87% |
| IMKTA | 1.21% | 8.71% | 31.80% |
| GRDN | 1.99% | 11.93% | 21.84% |
| USFD | -1.15% | -2.43% | 18.19% |
| SYMBOL | 6M | 12M | 5Y |
|---|---|---|---|
| ANDE | 76.36% | 101.33% | 186.45% |
| PSMT | 24.92% | 83.81% | 66.87% |
| GRDN | 59.96% | 80.39% | 137.44% |
| CASY | 33.30% | 78.60% | 248.46% |
| USFD | 19.07% | 48.69% | 135.55% |
| TBBB | 46.10% | 45.98% | 107.37% |
| SYMBOL | MCAP | 1M | 12M | 5Y | P/E | P/E fwd | PEG | EPS stab | EPS cagr |
|---|---|---|---|---|---|---|---|---|---|
| WMT NASDAQ Walmart Common Stock |
1,003B | 2.22% | 51.4% | 189% | 46.1 | 42.4 | 4.67 | -33.6% | 15.3% |
| AD AS Koninklijke Ahold Delhaize |
42.0B | 2.35% | 31.7% | 107% | 16.5 | 14.8 | 3.43 | 37.7% | 7.84% |
| TGT NYSE Target |
54.5B | 0.07% | 33.5% | -32.2% | 14.8 | 15.1 | 3.42 | 34.6% | 2.92% |
Performance: USFD vs S&P 500
| PERIOD | USFD | S&P 500 | DIFFERENCE |
|---|---|---|---|
| 1 Month | -2.43% | -3.48% | 1.08% |
| 3 Months | 18.19% | -4.38% | 23.60% |
| 6 Months | 19.07% | -1.79% | 21.24% |
| 12 Months | 48.69% | 31.52% | 13.05% |
| 5 Years | 135.55% | 72.80% | 36.31% |
USFD Performance FAQ
Does USFD outperform the market?
Yes, USFD significantly outperforms the market. Over the past 12 months, USFD returned 48.69% compared to 31.52% for the S&P 500.
What is the USFD return over the last 12 months?
USFD has returned 48.69% over the past 12 months, including dividends. Over 3 months the return was 18.19%, and over 5 years 135.55%.
How risky is USFD?
USFD has relatively low risk with a maximum drawdown of 19.01% over the past 3 years. The average drawdown is 4.98%.
USFD vs Sectors (12m)
Sorted by outperformance. Positive = USFD beats sector.
| SECTOR | ETF | DIFFERENCE 12M |
|---|---|---|
| Consumer Staples | XLP | 40.2% |
| Health Care | XLV | 37.6% |
| Real Estate | XLRE | 35.4% |
| Financials | XLF | 34.6% |
| Consumer Discretionary | XLY | 28% |
| Communication Services | XLC | 19.2% |
| Communication Services | XLC | 19.2% |
| Materials | XLB | 14.6% |
| Industrials | XLI | 7.3% |
| Technology | XLK | -0.4% |
| Energy | XLE | -7.6% |
USFD vs Asset Classes (12m)
| ASSET CLASS | ETF | DIFFERENCE 12M |
|---|---|---|
| S&P 500 | SPY | 13.05% |
| Gold | GLD | -8.2% |
| Long-Term Bonds | TLT | 47.9% |