(UMAC) Unusual Machines - Performance 207.3% in 12m
Compare UMAC with Indices, Sectors and Commodities and Bonds. Who performs better in which timeframe?
Performance Rating
39.87%
#10 in Group
Rel. Strength
98.89%
#90 in Universe
Total Return 12m
207.32%
#1 in Group
Total Return 5y
66.34%
#12 in Group
P/E -
(?) Percentile in Group
P/E Forward -
(?) Percentile in Group
PEG -
(?) Percentile in Group
FCF Yield -
(?) Percentile in Group
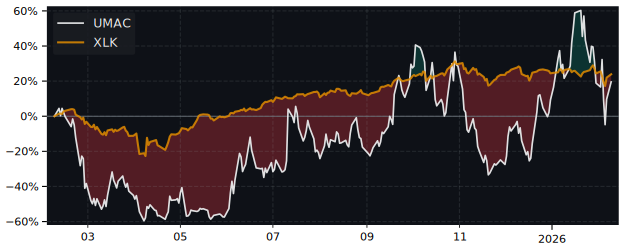
12m Total Return: UMAC (207.3%) vs XLK (-3.2%)
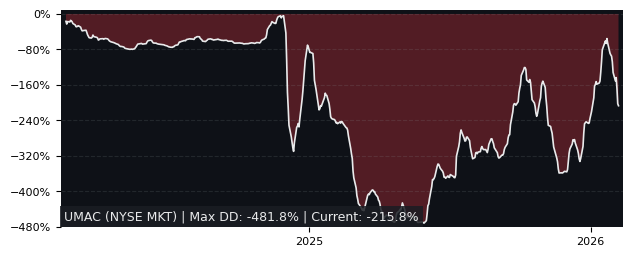
5y Drawdown (Underwater) Chart
Top Performers in Electronic Components
Overall best picks of Peer Group Selected by proven GARP Predictive Metrics, sorted by Growth Rating
| Symbol | 1m | 12m | 5y | P/E | P/E Forward | PEG | EPS Stability |
EPS CAGR |
|---|---|---|---|---|---|---|---|---|
| BELFB NASDAQ Bel Fuse |
-8.12% | 18.9% | 947% | 22.3 | 12.7 | 0.84 | 30.1% | -26.2% |
| GLW NYSE Corning |
-11.9% | 37% | 134% | 72.9 | 19.7 | 0.46 | -66.2% | -14.4% |
| KN NYSE Knowles Cor |
-12% | -8.36% | -4.3% | 58 | 11.9 | 1.12 | -24.3% | 12.7% |
Performance Comparison: UMAC vs XLK vs S&P 500
XLK (Technology Sector SPDR ETF) is the Sector Benchmark for UMAC
| Total Return (including Dividends) | UMAC | XLK | S&P 500 |
|---|---|---|---|
| 1 Month | -36.60% | -9.83% | -7.04% |
| 3 Months | -62.58% | -15.73% | -10.88% |
| 12 Months | 207.32% | -3.22% | 5.72% |
| 5 Years | 66.34% | 130.21% | 100.77% |
| Trend Score (consistency of price movement) | UMAC | XLK | S&P 500 |
| 1 Month | -85.7% | -80.8% | -76.1% |
| 3 Months | -88.6% | -87.1% | -86.4% |
| 12 Months | 80.7% | 32.8% | 67.8% |
| 5 Years | 62.5% | 86.4% | 84.3% |
| Relative Strength (compared with Indexes) | Rank in Peer Group | vs. XLK | vs. S&P 500 |
| 1 Month | #33 | -29.7% | -31.8% |
| 3 Month | #33 | -55.6% | -58.0% |
| 12 Month | #2 | 218% | 191% |
| 5 Years | #4 | 74.2% | 55.3% |
FAQs
Does UMAC Unusual Machines outperforms the market?
Yes,
over the last 12 months UMAC made 207.32%, while its related Sector, the Technology Sector SPDR (XLK) made -3.22%.
Over the last 3 months UMAC made -62.58%, while XLK made -15.73%.
Over the last 3 months UMAC made -62.58%, while XLK made -15.73%.
Performance Comparison UMAC vs Indeces and Sectors
UMAC vs. Indices UMAC is Over or Underperforming
| Symbol | 1w | 1m | 6m | 12m | |
|---|---|---|---|---|---|
| US S&P 500 | SPY | -6.61% | -29.6% | 236% | 202% |
| US NASDAQ 100 | QQQ | -6.12% | -28.7% | 237% | 204% |
| US Dow Jones Industrial 30 | DIA | -8.51% | -31.4% | 234% | 201% |
| German DAX 40 | DAX | -19.1% | -28.6% | 218% | 188% |
| Shanghai Shenzhen CSI 300 | CSI 300 | -13.6% | -28.9% | 232% | 199% |
| Hongkong Hang Seng | HSI | -14.3% | -25.5% | 235% | 191% |
| India NIFTY 50 | INDA | -10.6% | -40.0% | 237% | 207% |
| Brasil Bovespa | EWZ | -11.1% | -30.3% | 236% | 218% |
UMAC vs. Sectors UMAC is Over or Underperforming
| Symbol | 1w | 1m | 6m | 12m | |
|---|---|---|---|---|---|
| Communication Services | XLC | -6.42% | -29.0% | 228% | 194% |
| Consumer Discretionary | XLY | -5.02% | -30.4% | 234% | 200% |
| Consumer Staples | XLP | -11.9% | -36.5% | 229% | 195% |
| Energy | XLE | -7.57% | -24.7% | 237% | 220% |
| Financial | XLF | -9.32% | -31.7% | 229% | 188% |
| Health Care | XLV | -9.02% | -29.8% | 238% | 207% |
| Industrial | XLI | -9.11% | -30.6% | 237% | 203% |
| Materials | XLB | -10.1% | -29.2% | 244% | 215% |
| Real Estate | XLRE | -12.4% | -31.6% | 237% | 193% |
| Technology | XLK | -5.92% | -26.8% | 242% | 211% |
| Utilities | XLU | -12.1% | -34.5% | 232% | 181% |
| Aerospace & Defense | XAR | -11.3% | -36.0% | 227% | 184% |
| Biotech | XBI | -11.1% | -21.7% | 252% | 219% |
| Homebuilder | XHB | -6.00% | -27.4% | 256% | 219% |
| Retail | XRT | -6.37% | -30.9% | 244% | 214% |