(EUC) Europejskie Centrum - Performance 164.3% in 12m
Compare EUC with Indices, Sectors and Commodities and Bonds. Who performs better in which timeframe?
Performance Rating
-31.69%
#9 in Group
Rel. Strength
98.17%
#147 in Universe
Total Return 12m
164.32%
#1 in Group
Total Return 5y
-24.81%
#11 in Group
P/E -
(?) Percentile in Group
P/E Forward -
(?) Percentile in Group
PEG -
(?) Percentile in Group
FCF Yield 1.01%
31th Percentile in Group
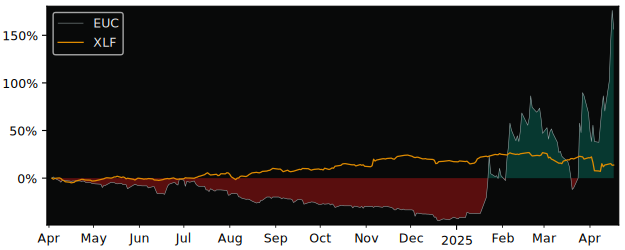
12m Total Return: EUC (164.3%) vs XLF (19%)
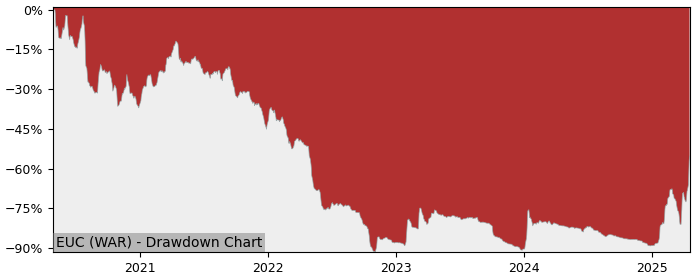
5y Drawdown (Underwater) Chart
Top Performers in Insurance Brokers
Overall best picks of Peer Group Selected by proven GARP Predictive Metrics, sorted by Growth Rating
Performance Comparison: EUC vs XLF vs S&P 500
XLF (Financial Sector SPDR Fund ETF) is the Sector Benchmark for EUC
| Total Return (including Dividends) | EUC | XLF | S&P 500 |
|---|---|---|---|
| 1 Month | 128.14% | -4.51% | -5.89% |
| 3 Months | 222.58% | -7.56% | -12.45% |
| 12 Months | 164.32% | 18.95% | 6.72% |
| 5 Years | -24.81% | 132.81% | 101.06% |
| Trend Score (consistency of price movement) | EUC | XLF | S&P 500 |
| 1 Month | 70.6% | -71.4% | -74.5% |
| 3 Months | 46.8% | -76.1% | -88.2% |
| 12 Months | 14.2% | 87.3% | 66.1% |
| 5 Years | -80.3% | 75.3% | 84.3% |
| Relative Strength (compared with Indexes) | Rank in Peer Group | vs. XLF | vs. S&P 500 |
| 1 Month | #1 | 139% | 142% |
| 3 Month | #1 | 249% | 268% |
| 12 Month | #1 | 122% | 148% |
| 5 Years | #10 | -67.7% | -62.6% |
FAQs
Does EUC Europejskie Centrum outperforms the market?
Yes,
over the last 12 months EUC made 164.32%, while its related Sector, the Financial Sector SPDR Fund (XLF) made 18.95%.
Over the last 3 months EUC made 222.58%, while XLF made -7.56%.
Over the last 3 months EUC made 222.58%, while XLF made -7.56%.
Performance Comparison EUC vs Indeces and Sectors
EUC vs. Indices EUC is Over or Underperforming
| Symbol | 1w | 1m | 6m | 12m | |
|---|---|---|---|---|---|
| US S&P 500 | SPY | 51.8% | 134% | 271% | 158% |
| US NASDAQ 100 | QQQ | 52.7% | 134% | 271% | 159% |
| US Dow Jones Industrial 30 | DIA | 53.0% | 134% | 270% | 159% |
| German DAX 40 | DAX | 46.4% | 138% | 254% | 146% |
| Shanghai Shenzhen CSI 300 | CSI 300 | 51.1% | 136% | 269% | 158% |
| Hongkong Hang Seng | HSI | 47.5% | 138% | 269% | 148% |
| India NIFTY 50 | INDA | 47.4% | 123% | 268% | 161% |
| Brasil Bovespa | EWZ | 48.2% | 133% | 268% | 174% |
EUC vs. Sectors EUC is Over or Underperforming
| Symbol | 1w | 1m | 6m | 12m | |
|---|---|---|---|---|---|
| Communication Services | XLC | 51.5% | 134% | 262% | 151% |
| Consumer Discretionary | XLY | 52.7% | 132% | 268% | 155% |
| Consumer Staples | XLP | 48.5% | 125% | 261% | 150% |
| Energy | XLE | 47.1% | 138% | 270% | 175% |
| Financial | XLF | 50.4% | 133% | 263% | 145% |
| Health Care | XLV | 51.4% | 136% | 272% | 165% |
| Industrial | XLI | 50.7% | 133% | 271% | 159% |
| Materials | XLB | 50.1% | 135% | 278% | 172% |
| Real Estate | XLRE | 46.5% | 131% | 269% | 147% |
| Technology | XLK | 53.2% | 137% | 278% | 166% |
| Utilities | XLU | 48.5% | 129% | 265% | 140% |
| Aerospace & Defense | XAR | 50.1% | 128% | 261% | 140% |
| Biotech | XBI | 48.2% | 140% | 285% | 173% |
| Homebuilder | XHB | 50.8% | 135% | 289% | 173% |
| Retail | XRT | 50.1% | 130% | 276% | 169% |