(FON) Fon SE - Performance 710.2% in 12m
Compare FON with Indices, Sectors and Commodities and Bonds. Who performs better in which timeframe?
Performance Rating
74.20%
#30 in Group
Rel. Strength
99.87%
#11 in Universe
Total Return 12m
710.19%
#2 in Group
Total Return 5y
1493.81%
#1 in Group
P/E 58.3
94th Percentile in Group
P/E Forward -
(?) Percentile in Group
PEG -
(?) Percentile in Group
FCF Yield -6.23%
(?) Percentile in Group
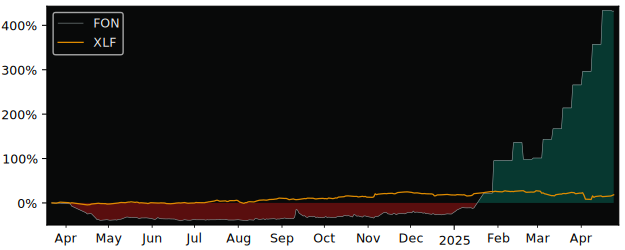
12m Total Return: FON (710.2%) vs XLF (17.2%)
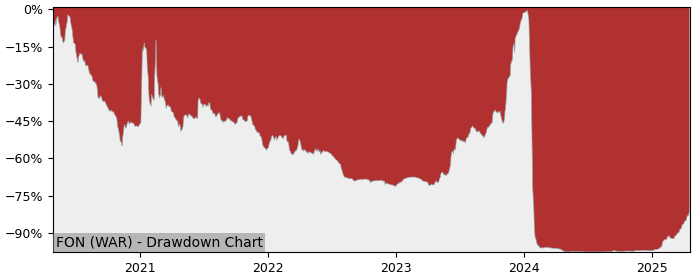
5y Drawdown (Underwater) Chart
Top Performers in Asset Management & Custody Banks
Overall best picks of Peer Group Selected by proven GARP Predictive Metrics, sorted by Growth Rating
| Symbol | 1m | 12m | 5y | P/E | P/E Forward | PEG | EPS Stability |
EPS CAGR |
|---|---|---|---|---|---|---|---|---|
| AMP NYSE Ameriprise Financial |
-7.97% | 12.4% | 375% | 14.1 | 12.4 | 0.94 | 30.9% | 31.1% |
| AGF-B TO AGF Management |
-8.03% | 25.6% | 220% | 6.36 | 5.35 | 1.25 | 82.9% | 18.1% |
| APO NYSE Apollo Global Management |
-16.6% | 13.4% | 263% | 17.2 | 15.1 | 1.37 | 22.6% | -4.44% |
| BCSF NYSE Bain Capital Specialty |
-12.4% | 2.74% | 154% | 8.09 | 10.4 | 1.07 | -1.20% | -8.73% |
| BK NYSE The Bank of New York Mellon |
-9.33% | 38% | 150% | 12.5 | 11.3 | 1.01 | 58.8% | 12.8% |
| TSLX NYSE Sixth Street Specialty |
-9.24% | 5.1% | 133% | 9.74 | 9.23 | 1.27 | -35.1% | -6.83% |
| PNNT NYSE PennantPark Investment |
-11.2% | 0.69% | 251% | 7.25 | 7.61 | 0.28 | -37.9% | -19.4% |
| FHI NYSE Federated Investors |
-7.78% | 12.3% | 130% | 11.7 | 9.27 | 1.78 | 45.6% | 9.29% |
Performance Comparison: FON vs XLF vs S&P 500
XLF (Financial Sector SPDR Fund ETF) is the Sector Benchmark for FON
| Total Return (including Dividends) | FON | XLF | S&P 500 |
|---|---|---|---|
| 1 Month | 69.90% | -5.96% | -8.16% |
| 3 Months | 337.50% | -6.11% | -12.80% |
| 12 Months | 710.19% | 17.19% | 6.85% |
| 5 Years | 1493.81% | 138.16% | 100.40% |
| Trend Score (consistency of price movement) | FON | XLF | S&P 500 |
| 1 Month | 97.8% | -69.9% | -70.9% |
| 3 Months | 97.7% | -80.9% | -90.1% |
| 12 Months | 83.6% | 86.2% | 62.2% |
| 5 Years | 55.7% | 75.1% | 84.2% |
| Relative Strength (compared with Indexes) | Rank in Peer Group | vs. XLF | vs. S&P 500 |
| 1 Month | #3 | 80.7% | 85.0% |
| 3 Month | #1 | 366% | 402% |
| 12 Month | #2 | 591% | 658% |
| 5 Years | #2 | 569% | 695% |
FAQs
Does FON Fon SE outperforms the market?
Yes,
over the last 12 months FON made 710.19%, while its related Sector, the Financial Sector SPDR Fund (XLF) made 17.19%.
Over the last 3 months FON made 337.50%, while XLF made -6.11%.
Over the last 3 months FON made 337.50%, while XLF made -6.11%.
Performance Comparison FON vs Indeces and Sectors
FON vs. Indices FON is Over or Underperforming
| Symbol | 1w | 1m | 6m | 12m | |
|---|---|---|---|---|---|
| US S&P 500 | SPY | 18.6% | 78.1% | 629% | 703% |
| US NASDAQ 100 | QQQ | 19.6% | 79.3% | 630% | 703% |
| US Dow Jones Industrial 30 | DIA | 19.6% | 77.8% | 628% | 706% |
| German DAX 40 | DAX | 16.5% | 76.8% | 610% | 692% |
| Shanghai Shenzhen CSI 300 | CSI 300 | 15.0% | 73.6% | 626% | 702% |
| Hongkong Hang Seng | HSI | 13.6% | 74.9% | 624% | 693% |
| India NIFTY 50 | INDA | 12.0% | 67.3% | 623% | 706% |
| Brasil Bovespa | EWZ | 12.7% | 71.2% | 623% | 720% |
FON vs. Sectors FON is Over or Underperforming
| Symbol | 1w | 1m | 6m | 12m | |
|---|---|---|---|---|---|
| Communication Services | XLC | 18.4% | 78.2% | 620% | 695% |
| Consumer Discretionary | XLY | 18.1% | 78.8% | 625% | 700% |
| Consumer Staples | XLP | 15.2% | 66.3% | 618% | 698% |
| Energy | XLE | 13.7% | 82.2% | 628% | 722% |
| Financial | XLF | 16.9% | 75.9% | 619% | 693% |
| Health Care | XLV | 18.6% | 78.1% | 629% | 712% |
| Industrial | XLI | 18.0% | 77.1% | 628% | 706% |
| Materials | XLB | 16.0% | 75.9% | 634% | 717% |
| Real Estate | XLRE | 15.2% | 73.3% | 626% | 695% |
| Technology | XLK | 20.9% | 81.5% | 636% | 710% |
| Utilities | XLU | 16.3% | 70.1% | 622% | 688% |
| Aerospace & Defense | XAR | 19.0% | 75.3% | 620% | 689% |
| Biotech | XBI | 15.2% | 82.5% | 641% | 717% |
| Homebuilder | XHB | 15.5% | 77.9% | 641% | 718% |
| Retail | XRT | 14.4% | 75.5% | 631% | 715% |