(HPK) Highpeak Energy - Performance -35.7% in 12m
Compare HPK with Indices, Sectors and Commodities and Bonds. Who performs better in which timeframe?
Performance Rating
-2.51%
#128 in Group
Rel. Strength
19.01%
#6471 in Universe
Total Return 12m
-35.69%
#121 in Group
Total Return 5y
-6.79%
#141 in Group
P/E 14.5
68th Percentile in Group
P/E Forward 7.95
40th Percentile in Group
PEG -
(?) Percentile in Group
FCF Yield 2.93%
38th Percentile in Group
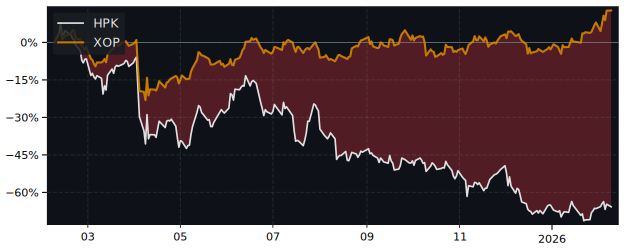
12m Total Return: HPK (-35.7%) vs XLE (-10.6%)
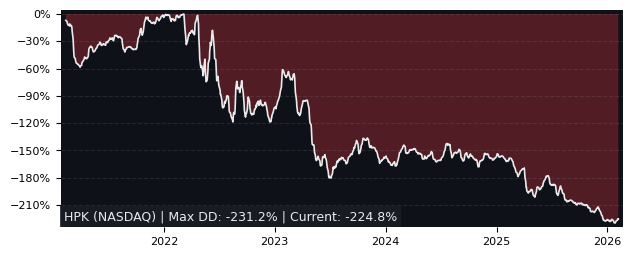
5y Drawdown (Underwater) Chart
Top Performers in Oil & Gas Exploration & Production
Overall best picks of Peer Group Selected by proven GARP Predictive Metrics, sorted by Growth Rating
| Symbol | 1m | 12m | 5y | P/E | P/E Forward | PEG | EPS Stability |
EPS CAGR |
|---|---|---|---|---|---|---|---|---|
| PEY TO Peyto |
8.46% | 37.8% | 1744% | 11.9 | 6.35 | 1.28 | 15.6% | -9.64% |
| KEI TO Kolibri Global Energy |
-15.4% | 123% | 1543% | 13.9 | 8.86 | 0.63 | 49.6% | 65.5% |
| VNOM NASDAQ Viper Energy Ut |
-5.4% | 12.5% | 704% | 9.98 | 31.6 | 0.64 | 54.4% | 156% |
| TOU TO Tourmaline Oil |
-4.38% | 1.2% | 577% | 17.3 | 9.51 | 0.24 | -39.1% | -17% |
| BSM NYSE Black Stone Minerals |
-3.11% | 2.69% | 351% | 12.2 | 7.17 | 1.22 | 24.3% | 28.8% |
| ATH TO Athabasca Oil |
-4.05% | -3.11% | 4050% | 5.32 | 10.3 | 0.2 | 19.3% | 32.6% |
| PBR-A NYSE Petróleo Brasileiro S.A. |
-15.3% | -12% | 491% | 10.2 | 4.02 | 0.23 | -13.2% | 2.95% |
| CNQ TO Canadian Natural Resources |
-5.09% | -21.2% | 462% | 13.4 | 11.2 | 0.33 | -36.2% | 13.9% |
Performance Comparison: HPK vs XLE vs S&P 500
XLE (Energy Sector SPDR Fund ETF) is the Sector Benchmark for HPK
| Total Return (including Dividends) | HPK | XLE | S&P 500 |
|---|---|---|---|
| 1 Month | -23.38% | -9.93% | -6.90% |
| 3 Months | -35.84% | -12.58% | -11.64% |
| 12 Months | -35.69% | -10.57% | 6.50% |
| 5 Years | -6.79% | 204.50% | 101.06% |
| Trend Score (consistency of price movement) | HPK | XLE | S&P 500 |
| 1 Month | -71.9% | -64.4% | -74.5% |
| 3 Months | -85.6% | -28.8% | -88.2% |
| 12 Months | -52.1% | -5.9% | 66.1% |
| 5 Years | 35.9% | 94.8% | 84.3% |
| Relative Strength (compared with Indexes) | Rank in Peer Group | vs. XLE | vs. S&P 500 |
| 1 Month | #160 | -14.9% | -17.7% |
| 3 Month | #143 | -26.6% | -27.4% |
| 12 Month | #121 | -28.1% | -39.6% |
| 5 Years | #147 | -69.4% | -53.6% |
FAQs
Does HPK Highpeak Energy outperforms the market?
No,
over the last 12 months HPK made -35.69%, while its related Sector, the Energy Sector SPDR Fund (XLE) made -10.57%.
Over the last 3 months HPK made -35.84%, while XLE made -12.58%.
Over the last 3 months HPK made -35.84%, while XLE made -12.58%.
Performance Comparison HPK vs Indeces and Sectors
HPK vs. Indices HPK is Over or Underperforming
| Symbol | 1w | 1m | 6m | 12m | |
|---|---|---|---|---|---|
| US S&P 500 | SPY | 11.1% | -16.5% | -24.9% | -42.2% |
| US NASDAQ 100 | QQQ | 11.9% | -15.5% | -24.6% | -40.6% |
| US Dow Jones Industrial 30 | DIA | 12.5% | -17.0% | -25.2% | -41.1% |
| German DAX 40 | DAX | 8.30% | -14.9% | -42.0% | -54.3% |
| Shanghai Shenzhen CSI 300 | CSI 300 | 10.3% | -15.4% | -31.8% | -41.7% |
| Hongkong Hang Seng | HSI | 7.26% | -12.7% | -28.4% | -52.6% |
| India NIFTY 50 | INDA | 8.01% | -29.1% | -27.4% | -39.0% |
| Brasil Bovespa | EWZ | 7.19% | -18.7% | -26.9% | -26.0% |
HPK vs. Sectors HPK is Over or Underperforming
| Symbol | 1w | 1m | 6m | 12m | |
|---|---|---|---|---|---|
| Communication Services | XLC | 11.8% | -16.4% | -34.1% | -49.8% |
| Consumer Discretionary | XLY | 12.8% | -17.8% | -27.7% | -44.2% |
| Consumer Staples | XLP | 8.27% | -25.4% | -35.0% | -50.2% |
| Energy | XLE | 5.58% | -13.5% | -25.3% | -25.1% |
| Financial | XLF | 9.84% | -18.8% | -32.7% | -55.1% |
| Health Care | XLV | 11.0% | -16.1% | -23.6% | -35.1% |
| Industrial | XLI | 9.98% | -17.9% | -24.9% | -40.7% |
| Materials | XLB | 8.16% | -16.6% | -17.8% | -28.2% |
| Real Estate | XLRE | 6.06% | -19.9% | -26.5% | -52.8% |
| Technology | XLK | 12.2% | -13.1% | -18.0% | -33.4% |
| Utilities | XLU | 8.31% | -22.3% | -30.9% | -60.8% |
| Aerospace & Defense | XAR | 9.11% | -22.7% | -34.4% | -59.8% |
| Biotech | XBI | 5.42% | -9.39% | -10.4% | -25.5% |
| Homebuilder | XHB | 10.9% | -16.0% | -7.34% | -26.5% |
| Retail | XRT | 10.8% | -19.9% | -19.8% | -31.3% |