(LUV) Southwest Airlines - Performance -0.5% in 12m
Compare LUV with Indices, Sectors and Commodities and Bonds. Who performs better in which timeframe?
Performance Rating
-10.34%
#15 in Group
Rel. Strength
42.34%
#4632 in Universe
Total Return 12m
-0.51%
#8 in Group
Total Return 5y
-3.71%
#16 in Group
P/E 32.7
100th Percentile in Group
P/E Forward 15.0
80th Percentile in Group
PEG 0.36
43th Percentile in Group
FCF Yield -12.52%
18th Percentile in Group
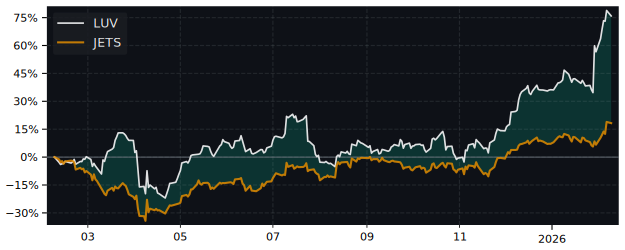
12m Total Return: LUV (-0.5%) vs JETS (-4.7%)
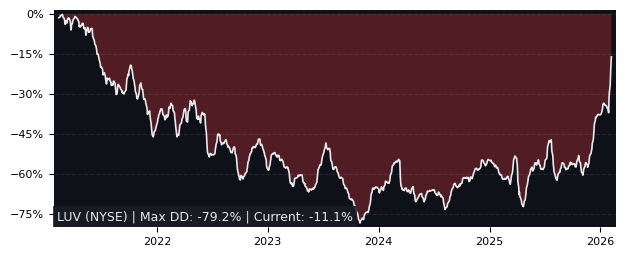
5y Drawdown (Underwater) Chart
Top Performers in Passenger Airlines
Overall best picks of Peer Group Selected by proven GARP Predictive Metrics, sorted by Growth Rating
| Symbol | 1m | 12m | 5y | P/E | P/E Forward | PEG | EPS Stability |
EPS CAGR |
|---|---|---|---|---|---|---|---|---|
| EIF TO Exchange Income |
-1.7% | 13.5% | 165% | 19.9 | 13.8 | 1.54 | 41.6% | 27.9% |
| SKYW NASDAQ SkyWest |
-6.63% | 20.2% | 224% | 11 | - | 1.02 | 48.1% | 34.7% |
| UAL NASDAQ United Airlines Holdings |
-13.6% | 27.5% | 173% | 6.03 | 7.13 | 1.02 | 55.6% | 30.1% |
| CPA NYSE Copa Holdings |
-5.93% | -2.18% | 147% | 6.14 | 5.66 | 0.16 | 76.4% | 31.7% |
| ALK NYSE Alaska Air |
-22.1% | -5.93% | 50.5% | 14.7 | 10.5 | 1.3 | 12.4% | 26% |
| AF PA Air France-KLM |
-21.5% | -21% | -66.3% | 8 | 2.05 | 0.09 | 43.2% | 63.8% |
Performance Comparison: LUV vs JETS vs S&P 500
JETS (U.S. Global Jets ETF) is the Sector Benchmark for LUV
| Total Return (including Dividends) | LUV | JETS | S&P 500 |
|---|---|---|---|
| 1 Month | -23.59% | -13.25% | -4.31% |
| 3 Months | -18.21% | -26.32% | -7.85% |
| 12 Months | -0.51% | -4.74% | 10.76% |
| 5 Years | -3.71% | 46.47% | 106.31% |
| Trend Score (consistency of price movement) | LUV | JETS | S&P 500 |
| 1 Month | -68.3% | -37.4% | -35.6% |
| 3 Months | -39.3% | -94.9% | -89.7% |
| 12 Months | 54.3% | 46.3% | 58.3% |
| 5 Years | -64.9% | 4.1% | 84.2% |
| Relative Strength (compared with Indexes) | Rank in Peer Group | vs. JETS | vs. S&P 500 |
| 1 Month | #24 | -11.9% | -20.2% |
| 3 Month | #12 | 11.0% | -11.2% |
| 12 Month | #9 | 4.44% | -10.2% |
| 5 Years | #16 | -34.3% | -53.3% |
FAQs
Does LUV Southwest Airlines outperforms the market?
Yes,
over the last 12 months LUV made -0.51%, while its related Sector, the U.S. Global Jets (JETS) made -4.74%.
Over the last 3 months LUV made -18.21%, while JETS made -26.32%.
Over the last 3 months LUV made -18.21%, while JETS made -26.32%.
Performance Comparison LUV vs Indeces and Sectors
LUV vs. Indices LUV is Over or Underperforming
| Symbol | 1w | 1m | 6m | 12m | |
|---|---|---|---|---|---|
| US S&P 500 | SPY | 3.04% | -19.3% | -4.68% | -11.3% |
| US NASDAQ 100 | QQQ | 1.08% | -19.4% | -4.68% | -12.5% |
| US Dow Jones Industrial 30 | DIA | 5.11% | -17.8% | -4.94% | -7.49% |
| German DAX 40 | DAX | 5.70% | -19.8% | -23.1% | -24.0% |
| Shanghai Shenzhen CSI 300 | CSI 300 | 9.57% | -20.1% | -3.26% | -9.13% |
| Hongkong Hang Seng | HSI | 5.31% | -20.7% | -6.55% | -14.5% |
| India NIFTY 50 | INDA | 10.5% | -25.2% | -6.28% | -2.31% |
| Brasil Bovespa | EWZ | 3.29% | -25.6% | -9.18% | 4.99% |
LUV vs. Sectors LUV is Over or Underperforming
| Symbol | 1w | 1m | 6m | 12m | |
|---|---|---|---|---|---|
| Communication Services | XLC | 3.18% | -18.0% | -13.4% | -22.9% |
| Consumer Discretionary | XLY | 0.69% | -19.6% | -7.84% | -14.9% |
| Consumer Staples | XLP | 10.5% | -26.3% | -10.0% | -10.0% |
| Energy | XLE | 6.39% | -12.0% | -2.25% | 11.4% |
| Financial | XLF | 5.00% | -18.8% | -12.8% | -19.8% |
| Health Care | XLV | 6.06% | -18.6% | -2.67% | -0.77% |
| Industrial | XLI | 4.87% | -19.5% | -5.03% | -7.42% |
| Materials | XLB | 6.29% | -19.1% | 2.21% | 4.83% |
| Real Estate | XLRE | 7.87% | -21.7% | -2.53% | -15.6% |
| Technology | XLK | -0.77% | -19.1% | 0.19% | -6.75% |
| Utilities | XLU | 7.19% | -25.3% | -7.78% | -21.0% |
| Aerospace & Defense | XAR | 3.48% | -23.3% | -16.0% | -27.5% |
| Biotech | XBI | 3.91% | -15.8% | 8.41% | 1.74% |
| Homebuilder | XHB | 4.79% | -17.6% | 10.3% | 7.46% |
| Retail | XRT | 5.83% | -20.7% | -0.56% | 3.11% |