(AL) Air Lease - Performance -9.7% in 12m
Compare AL with Indices, Sectors and Commodities and Bonds. Who performs better in which timeframe?
Performance Rating
48.57%
#43 in Group
Rel. Strength
34.61%
#5247 in Universe
Total Return 12m
-9.66%
#46 in Group
Total Return 5y
128.80%
#42 in Group
P/E 12.9
27th Percentile in Group
P/E Forward 6.94
4th Percentile in Group
PEG 0.91
15th Percentile in Group
FCF Yield -10.13%
1th Percentile in Group
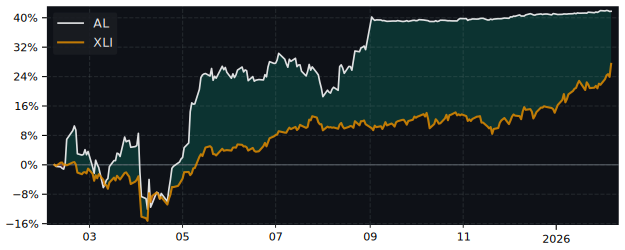
12m Total Return: AL (-9.7%) vs XLI (7.3%)
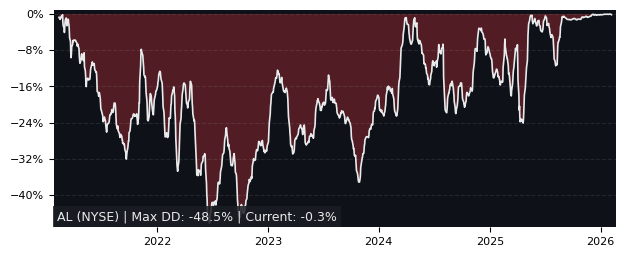
5y Drawdown (Underwater) Chart
Top Performers in Trading Companies & Distributors
Overall best picks of Peer Group Selected by proven GARP Predictive Metrics, sorted by Growth Rating
| Symbol | 1m | 12m | 5y | P/E | P/E Forward | PEG | EPS Stability |
EPS CAGR |
|---|---|---|---|---|---|---|---|---|
| EFN TO Element Fleet Management |
8.07% | 45.7% | 257% | 21.6 | 16.6 | 1.15 | 73.2% | 24.6% |
| BECN NASDAQ Beacon Roofing Supply |
0.22% | 27.7% | 539% | 21.7 | 16.5 | 1.65 | 21.6% | 102% |
| GATX NYSE GATX |
-8.81% | 16.4% | 171% | 18.9 | 19.1 | 0.87 | 60.0% | 20.4% |
| AER NYSE AerCap Holdings |
-1.41% | 21.4% | 333% | 9.02 | 7.44 | 0.91 | 59.4% | 18.5% |
| WCC NYSE WESCO International |
-4.58% | 1.85% | 558% | 11.5 | 10.7 | 1.29 | 47.8% | 36.6% |
| MGRC NASDAQ McGrath RentCorp |
-10.2% | -2.5% | 111% | 10.8 | 16.6 | 1.07 | 50.8% | 22.1% |
| URI NYSE United Rentals |
0.04% | -0.31% | 498% | 14.8 | 12.9 | 1.15 | 87.4% | 39% |
| RXL PA Rexel S.A |
-14.1% | -3.9% | 214% | 19.6 | 8.47 | 0.97 | 3.50% | 18.9% |
Performance Comparison: AL vs XLI vs S&P 500
XLI (Industrial Sector SPDR ETF) is the Sector Benchmark for AL
| Total Return (including Dividends) | AL | XLI | S&P 500 |
|---|---|---|---|
| 1 Month | -7.90% | -3.92% | -4.77% |
| 3 Months | -2.46% | -8.26% | -9.81% |
| 12 Months | -9.66% | 7.25% | 9.54% |
| 5 Years | 128.80% | 121.13% | 104.83% |
| Trend Score (consistency of price movement) | AL | XLI | S&P 500 |
| 1 Month | -51.8% | -47.5% | -51.2% |
| 3 Months | -33.4% | -89.9% | -90.1% |
| 12 Months | -8.10% | 58.9% | 59.4% |
| 5 Years | 59.2% | 87.4% | 84.2% |
| Relative Strength (compared with Indexes) | Rank in Peer Group | vs. XLI | vs. S&P 500 |
| 1 Month | #53 | -4.14% | -3.28% |
| 3 Month | #24 | 6.32% | 8.15% |
| 12 Month | #47 | -15.8% | -17.5% |
| 5 Years | #43 | 3.47% | 11.7% |
FAQs
Does AL Air Lease outperforms the market?
No,
over the last 12 months AL made -9.66%, while its related Sector, the Industrial Sector SPDR (XLI) made 7.25%.
Over the last 3 months AL made -2.46%, while XLI made -8.26%.
Over the last 3 months AL made -2.46%, while XLI made -8.26%.
Performance Comparison AL vs Indeces and Sectors
AL vs. Indices AL is Over or Underperforming
| Symbol | 1w | 1m | 6m | 12m | |
|---|---|---|---|---|---|
| US S&P 500 | SPY | 3.57% | -3.13% | 8.99% | -19.2% |
| US NASDAQ 100 | QQQ | 2.18% | -3.15% | 8.75% | -19.9% |
| US Dow Jones Industrial 30 | DIA | 4.96% | -2.19% | 8.61% | -15.7% |
| German DAX 40 | DAX | 3.25% | -4.49% | -9.40% | -31.1% |
| Shanghai Shenzhen CSI 300 | CSI 300 | 5.58% | -4.81% | 8.68% | -19.3% |
| Hongkong Hang Seng | HSI | 2.92% | -4.69% | 6.07% | -25.2% |
| India NIFTY 50 | INDA | 4.59% | -11.0% | 6.28% | -13.7% |
| Brasil Bovespa | EWZ | 1.39% | -10.0% | 5.25% | -2.92% |
AL vs. Sectors AL is Over or Underperforming
| Symbol | 1w | 1m | 6m | 12m | |
|---|---|---|---|---|---|
| Communication Services | XLC | 3.47% | -2.91% | -0.08% | -27.0% |
| Consumer Discretionary | XLY | 2.72% | -2.92% | 6.55% | -22.1% |
| Consumer Staples | XLP | 8.42% | -9.98% | 3.53% | -19.2% |
| Energy | XLE | 6.14% | 3.20% | 10.6% | 1.71% |
| Financial | XLF | 3.99% | -4.11% | 0.83% | -28.8% |
| Health Care | XLV | 6.02% | -1.27% | 11.2% | -8.77% |
| Industrial | XLI | 4.45% | -3.98% | 8.16% | -16.9% |
| Materials | XLB | 4.34% | -4.09% | 15.1% | -5.71% |
| Real Estate | XLRE | 7.07% | -4.96% | 11.0% | -24.3% |
| Technology | XLK | 0.90% | -2.29% | 14.0% | -14.1% |
| Utilities | XLU | 6.55% | -8.26% | 6.33% | -30.8% |
| Aerospace & Defense | XAR | 4.32% | -7.28% | -2.35% | -35.3% |
| Biotech | XBI | 0.89% | 1.03% | 20.8% | -6.17% |
| Homebuilder | XHB | 3.57% | -2.07% | 23.7% | -2.27% |
| Retail | XRT | 4.47% | -4.07% | 12.7% | -5.60% |