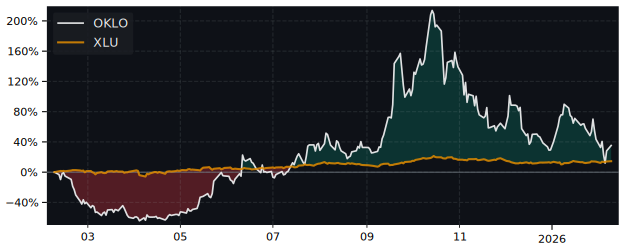
OKLO Performance: 119.5% Return (12 Months)
OKLO returned 119.5% over 12 months, outperforming the S&P 500 (31.5%). Volatility: 78.3%.
| P/E Trailing | 0.00 |
| P/E Forward | 0.00 |
| 52 Week High | 174.14 USD |
| 52 Week Low | 19.80 USD |
| VRO Trend Strength ±100 | 9.58 |
| Buy Signal ±3 | -1.39 |
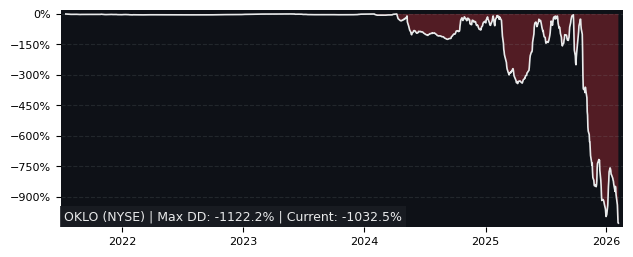
| Max Drawdown | 73.83% |
| Mean Drawdown | 24.05% |
Top Performer in Electric Utilities (5/45)
| SYMBOL | 1W | 1M | 3M |
|---|---|---|---|
| ELPC | 8.31% | 11.13% | 37.40% |
| ENGI | 3.98% | 9.24% | 26.51% |
| RWE | 4.50% | 12.17% | 24.89% |
| ELE | 4.42% | 13.65% | 21.78% |
| CIG | 6.01% | 14.52% | 20.58% |
| OKLO | 5.59% | -22.41% | -46.13% |
| SYMBOL | 6M | 12M | 5Y |
|---|---|---|---|
| OKLO | -65.26% | 119.47% | 382.26% |
| ELPC | 50.68% | 116.80% | 83.53% |
| RWE | 48.28% | 94.91% | 99.18% |
| ENGI | 58.00% | 80.13% | 252.23% |
| ELE | 37.15% | 69.47% | 117.63% |
| EDN | 96.91% | 21.03% | 756.02% |
| SYMBOL | MCAP | 1M | 12M | 5Y | P/E | P/E fwd | PEG | EPS stab | EPS cagr |
|---|---|---|---|---|---|---|---|---|---|
| IBE MC Iberdrola S.A. |
159B | 5.49% | 47.6% | 123% | 24.2 | 20.8 | 3.52 | -4.20% | -1.48% |
| TRN MI Terna Rete Elettrica |
23.2B | 1.81% | 34.0% | 100% | 18.2 | 19.9 | 2.14 | 80.7% | 11.1% |
Performance: OKLO vs S&P 500
| PERIOD | OKLO | S&P 500 | DIFFERENCE |
|---|---|---|---|
| 1 Month | -22.41% | -3.48% | -19.61% |
| 3 Months | -46.13% | -4.38% | -43.66% |
| 6 Months | -65.26% | -1.79% | -64.63% |
| 12 Months | 119.47% | 31.52% | 66.87% |
| 5 Years | 382.26% | 72.80% | 196.92% |
OKLO Performance FAQ
Does OKLO outperform the market?
Yes, OKLO significantly outperforms the market. Over the past 12 months, OKLO returned 119.47% compared to 31.52% for the S&P 500.
What is the OKLO return over the last 12 months?
OKLO has returned 119.47% over the past 12 months, including dividends. Over 3 months the return was -46.13%, and over 5 years 382.26%.
How risky is OKLO?
OKLO has relatively low risk with a maximum drawdown of 73.83% over the past 3 years. The average drawdown is 24.05%.
OKLO vs Sectors (12m)
Sorted by outperformance. Positive = OKLO beats sector.
| SECTOR | ETF | DIFFERENCE 12M |
|---|---|---|
| Consumer Staples | XLP | 111% |
| Health Care | XLV | 108.4% |
| Real Estate | XLRE | 106.2% |
| Financials | XLF | 105.4% |
| Consumer Discretionary | XLY | 98.8% |
| Communication Services | XLC | 90% |
| Communication Services | XLC | 90% |
| Materials | XLB | 85.3% |
| Industrials | XLI | 78.1% |
| Technology | XLK | 70.4% |
| Energy | XLE | 63.2% |
OKLO vs Asset Classes (12m)
| ASSET CLASS | ETF | DIFFERENCE 12M |
|---|---|---|
| S&P 500 | SPY | 66.87% |
| Gold | GLD | 62.6% |
| Long-Term Bonds | TLT | 118.7% |