(APP) Applovin - Performance 236.2% in 12m
Compare APP with Indices, Sectors and Commodities and Bonds. Who performs better in which timeframe?
Performance Rating
54.12%
#18 in Group
Rel. Strength
99.16%
#68 in Universe
Total Return 12m
236.23%
#5 in Group
Total Return 5y
249.89%
#11 in Group
P/E 52.6
72th Percentile in Group
P/E Forward 42.9
72th Percentile in Group
PEG 1.83
69th Percentile in Group
FCF Yield 2.59%
98th Percentile in Group
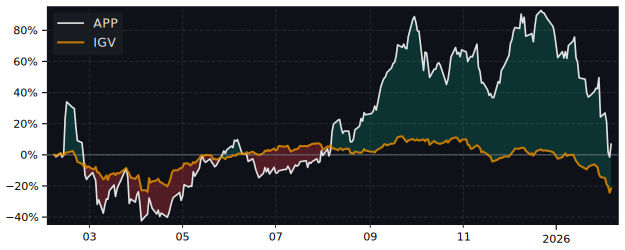
12m Total Return: APP (236.2%) vs XLK (-2.6%)
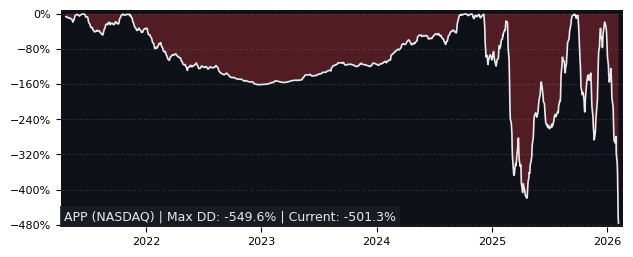
5y Drawdown (Underwater) Chart
Top Performers in Application Software
Overall best picks of Peer Group Selected by proven GARP Predictive Metrics, sorted by Growth Rating
| Symbol | 1m | 12m | 5y | P/E | P/E Forward | PEG | EPS Stability |
EPS CAGR |
|---|---|---|---|---|---|---|---|---|
| CSU TO Constellation Software |
-0.43% | 25.3% | 244% | 97.1 | 35 | 1.21 | 49.3% | 2.62% |
| FICO NYSE Fair Isaac |
-2.01% | 57.8% | 501% | 78.7 | 58.1 | 1.65 | 72.6% | 27.4% |
| SAP XETRA SAP SE |
-10.3% | 37.8% | 128% | 84.8 | 36 | 1.66 | 5.90% | 11.5% |
| SAP NYSE SAP SE |
-8.07% | 42.4% | 138% | 86.1 | 36.5 | 1.68 | 11.2% | 11.5% |
| PTC NASDAQ PTC |
-12.7% | -21.8% | 117% | 43 | 24.7 | 1.52 | 3.20% | -7.28% |
| APP NASDAQ Applovin |
-27.4% | 236% | 250% | 52.6 | 42.9 | 1.83 | 78.5% | 178% |
| INTU NASDAQ Intuit |
-5.66% | -6.11% | 127% | 55 | 27 | 1.76 | 34.1% | -14% |
| SSNC NASDAQ SS&C Technologies Holdings |
-10.7% | 21.7% | 54.6% | 25.4 | 13.1 | 0.92 | 9.40% | 10.8% |
Performance Comparison: APP vs XLK vs S&P 500
XLK (Technology Sector SPDR ETF) is the Sector Benchmark for APP
| Total Return (including Dividends) | APP | XLK | S&P 500 |
|---|---|---|---|
| 1 Month | -27.35% | -12.04% | -8.88% |
| 3 Months | -32.58% | -20.27% | -14.53% |
| 12 Months | 236.23% | -2.61% | 4.14% |
| 5 Years | 249.89% | 125.73% | 98.04% |
| Trend Score (consistency of price movement) | APP | XLK | S&P 500 |
| 1 Month | -76.0% | -76.4% | -74.2% |
| 3 Months | -79.6% | -89.5% | -89.4% |
| 12 Months | 85.4% | 28.3% | 64% |
| 5 Years | 32.0% | 86.3% | 84.2% |
| Relative Strength (compared with Indexes) | Rank in Peer Group | vs. XLK | vs. S&P 500 |
| 1 Month | #173 | -17.4% | -20.3% |
| 3 Month | #136 | -15.4% | -21.1% |
| 12 Month | #5 | 245% | 223% |
| 5 Years | #4 | 158% | 168% |
FAQs
Does APP Applovin outperforms the market?
Yes,
over the last 12 months APP made 236.23%, while its related Sector, the Technology Sector SPDR (XLK) made -2.61%.
Over the last 3 months APP made -32.58%, while XLK made -20.27%.
Over the last 3 months APP made -32.58%, while XLK made -20.27%.
Performance Comparison APP vs Indeces and Sectors
APP vs. Indices APP is Over or Underperforming
| Symbol | 1w | 1m | 6m | 12m | |
|---|---|---|---|---|---|
| US S&P 500 | SPY | 1.32% | -18.5% | 55.0% | 232% |
| US NASDAQ 100 | QQQ | 1.97% | -17.6% | 55.9% | 232% |
| US Dow Jones Industrial 30 | DIA | 2.46% | -18.3% | 54.0% | 235% |
| German DAX 40 | DAX | -4.48% | -20.0% | 34.9% | 218% |
| Shanghai Shenzhen CSI 300 | CSI 300 | -3.83% | -23.8% | 49.2% | 228% |
| Hongkong Hang Seng | HSI | -3.48% | -19.2% | 50.2% | 222% |
| India NIFTY 50 | INDA | -7.22% | -30.3% | 48.6% | 233% |
| Brasil Bovespa | EWZ | -4.12% | -22.2% | 50.0% | 248% |
APP vs. Sectors APP is Over or Underperforming
| Symbol | 1w | 1m | 6m | 12m | |
|---|---|---|---|---|---|
| Communication Services | XLC | 0.67% | -18.0% | 46.0% | 224% |
| Consumer Discretionary | XLY | 1.80% | -19.0% | 52.0% | 229% |
| Consumer Staples | XLP | -2.59% | -30.1% | 42.9% | 226% |
| Energy | XLE | -3.61% | -13.8% | 54.1% | 250% |
| Financial | XLF | -0.18% | -20.0% | 46.2% | 223% |
| Health Care | XLV | 0.95% | -18.1% | 55.3% | 240% |
| Industrial | XLI | 0.18% | -20.3% | 54.6% | 234% |
| Materials | XLB | -0.97% | -20.5% | 60.7% | 245% |
| Real Estate | XLRE | -2.93% | -23.4% | 51.7% | 223% |
| Technology | XLK | 2.78% | -15.3% | 62.4% | 239% |
| Utilities | XLU | -1.09% | -24.5% | 49.2% | 218% |
| Aerospace & Defense | XAR | -0.41% | -24.2% | 46.2% | 216% |
| Biotech | XBI | -2.01% | -14.0% | 66.7% | 246% |
| Homebuilder | XHB | -0.09% | -18.8% | 70.2% | 248% |
| Retail | XRT | -1.68% | -22.7% | 57.7% | 243% |