(LSEAW) Landsea Homes - Performance -82.1% in 12m
Compare LSEAW with Indices, Sectors and Commodities and Bonds. Who performs better in which timeframe?
Performance Rating
-64.96%
#35 in Group
Rel. Strength 12m
3.42%
#7540 in Universe
Total Return 12m
-82.05%
#36 in Group
Total Return 5y
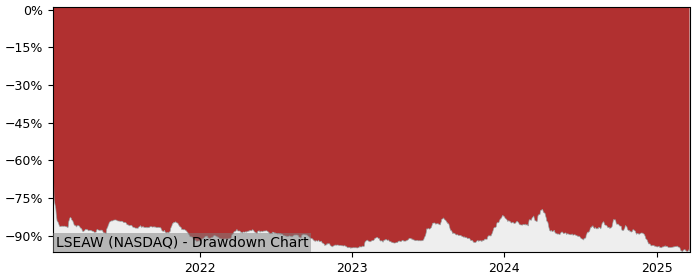
-96.44%
#35 in Group
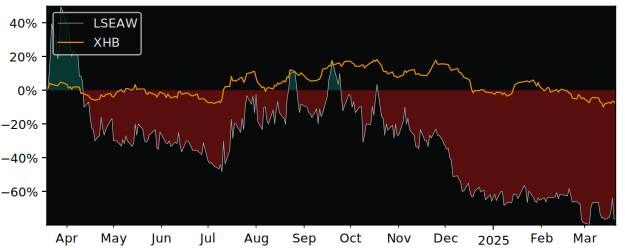
12m Total Return: LSEAW (-82.1%) vs XHB (-10.7%)
5y Drawdown (Underwater) Chart
Top Performers in Homebuilding
Overall best picks of Peer Group (based on Performance, Valuations and Relative Strength)
| Symbol | 1m | 12m | 5y | P/E | P/B | Growth Rating |
|---|---|---|---|---|---|---|
| TMHC NYSE Taylor Morn Home |
-1.80% | -1.28% | 646% | 7.02 | 1.03 | 84.74 |
| GRBK NYSE Green Brick Partners |
1.55% | -2.56% | 873% | 6.87 | 1.64 | 81.77 |
| TOL NYSE Toll Brothers |
-3.98% | -15.0% | 717% | 7.53 | 1.39 | 76.77 |
| MHO NYSE M/I Homes |
-0.22% | -9.38% | 807% | 5.95 | 1.06 | 73.48 |
| PHM NYSE PulteGroup |
1.22% | -10.6% | 510% | 6.88 | 1.73 | 70.20 |
Performance Duell LSEAW vs XHB
| Total Return (including Dividends) | LSEAW | XHB | S&P 500 |
|---|---|---|---|
| 1 Month | -31.37% | -3.14% | -5.56% |
| 3 Months | -45.10% | -7.89% | -5.16% |
| 12 Months | -82.05% | -10.69% | 9.56% |
| 5 Years | -96.44% | 309.29% | 171.25% |
| Relative Strength (compared with Indexes) | Rank in Peer Group | vs. XHB | vs. S&P 500 |
| 1 Month | #36 | -29.2% | -27.3% |
| 3 Month | #35 | -40.4% | -42.1% |
| 12 Month | #35 | -79.9% | -83.6% |
| 5 Years | #35 | -98.0% | -97.8% |
| Trend Score (consistency of price movement) | LSEAW | XHB | S&P 500 |
| 1 Month | -31.8% | -66.5% | -81.3% |
| 3 Months | -65.5% | -63.3% | -31.9% |
| 12 Months | -64.1% | 9.4% | 88.4% |
| 5 Years | -22.1% | 81.5% | 84.5% |
FAQs
Does LSEAW Landsea Homes outperforms the market?
No,
over the last 12 months LSEAW made -82.05%, while its related Sector, the SPDR S&P Homebuilders (XHB) made -10.69%.
Over the last 3 months LSEAW made -45.10%, while XHB made -7.89%.
Over the last 3 months LSEAW made -45.10%, while XHB made -7.89%.
Performance Comparison LSEAW vs Indeces and Sectors
LSEAW vs. Indices LSEAW is Over or Underperforming
| Symbol | 1w | 1m | 6m | 12m | |
|---|---|---|---|---|---|
| US S&P 500 | SPY | 0.56% | -25.8% | -76.8% | -91.6% |
| US NASDAQ 100 | QQQ | 0.40% | -23.9% | -77.1% | -90.7% |
| US Dow Jones Industrial 30 | DIA | -0.10% | -27.9% | -77.6% | -90.4% |
| German DAX 40 | DAX | 1.25% | -33.3% | -98.6% | -107% |
| Shanghai Shenzhen CSI 300 | CSI 300 | 3.68% | -30.2% | -94.4% | -94.0% |
| Hongkong Hang Seng | HSI | 2.99% | -35.0% | -85.0% | -100% |
| India NIFTY 50 | INDA | -4.11% | -35.9% | -65.1% | -84.6% |
| Brasil Bovespa | EWZ | -0.45% | -37.4% | -73.3% | -71.1% |
LSEAW vs. Sectors LSEAW is Over or Underperforming
| Symbol | 1w | 1m | 6m | 12m | |
|---|---|---|---|---|---|
| Communication Services | XLC | -0.34% | -25.9% | -87.6% | -103% |
| Consumer Discretionary | XLY | -0.22% | -22.1% | -77.0% | -91.1% |
| Consumer Staples | XLP | 1.66% | -27.6% | -73.6% | -89.4% |
| Energy | XLE | -1.46% | -33.1% | -82.1% | -83.7% |
| Financial | XLF | -0.75% | -28.4% | -86.7% | -103% |
| Health Care | XLV | 0.12% | -30.7% | -72.8% | -84.2% |
| Industrial | XLI | 0.52% | -29.9% | -76.9% | -89.6% |
| Materials | XLB | 1.46% | -28.9% | -68.7% | -77.3% |
| Real Estate | XLRE | 1.59% | -29.2% | -71.0% | -93.0% |
| Technology | XLK | 0.68% | -23.8% | -73.9% | -85.2% |
| Utilities | XLU | 0.57% | -30.0% | -76.3% | -108% |
| Aerospace & Defense | XAR | -0.18% | -33.1% | -82.6% | -101% |
| Biotech | XBI | 1.33% | -28.1% | -65.3% | -76.2% |
| Homebuilder | XHB | 0.98% | -28.2% | -56.5% | -71.4% |
| Retail | XRT | 0.04% | -22.8% | -68.3% | -73.5% |