LYG Performance: 64.3% Return (12 Months)
LYG returned 64.3% over 12 months, outperforming the S&P 500 (31.0%). Volatility: 28.0%.
RS IBD
62.46
Top 46% in Peers
Volatility
28.0%
Top 41% in Peers
Total Return 12m
64.30%
Top 57% in Peers
RS Rating
75.61
Top 46% in Peers
P/E
| P/E Trailing | 14.1 |
| P/E Forward | 10.2 |
High / Low 52w
| 52 Week High | 6.10 USD |
| 52 Week Low | 3.34 USD |
Sentiment
| VRO Trend Strength ±100 | 77.63 |
| Buy Signal ±3 | 0.76 |
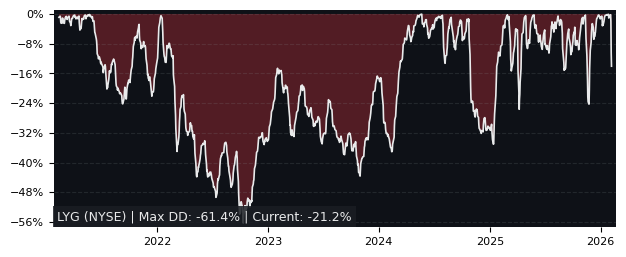
Drawdowns 3y
| Max Drawdown | 22.72% |
| Mean Drawdown | 6.14% |
Compare vs 54 peers in Diversified Banks
12m Total Return: LYG (64.3%) vs PEER ETF
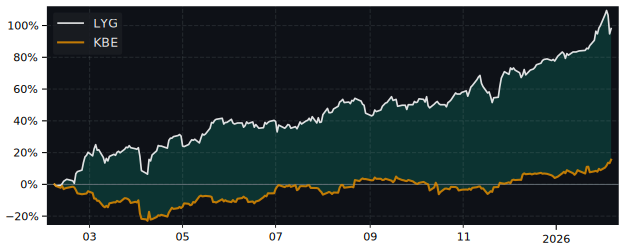
5y Drawdown (Underwater) Chart
Top Performer in Diversified Banks (5/54)
Short Term Performance
| SYMBOL | 1W | 1M | 3M |
|---|---|---|---|
| KB | 9.28% | 6.55% | 26.71% |
| SHG | 7.25% | 10.45% | 26.45% |
| ITUB | 8.66% | 9.00% | 25.20% |
| BBT | 3.48% | 9.80% | 19.73% |
| NTB | 4.03% | 11.53% | 13.32% |
| LYG | 7.34% | 4.74% | 2.83% |
Long Term Performance
| SYMBOL | 6M | 12M | 5Y |
|---|---|---|---|
| SHG | 38.11% | 126.23% | 158.63% |
| WF | 33.68% | 124.28% | 265.76% |
| KB | 41.92% | 119.84% | 190.01% |
| BAP | 37.03% | 114.32% | 171.94% |
| CIB | 44.46% | 110.86% | 310.79% |
| LYG | 27.25% | 64.30% | 194.16% |
Overall Best Picks of Peer Group (GARP Metrics)
| SYMBOL | MCAP | 1M | 12M | 5Y | P/E | P/E fwd | PEG | EPS stab | EPS cagr |
|---|---|---|---|---|---|---|---|---|---|
| BCH NYSE Banco De Chile |
18.6B | 1.71% | 60.7% | 137% | 14.5 | 27.3 | 9.10 | -65.0% | -4.44% |
| LYG NYSE Lloyds Banking |
76.2B | 4.74% | 64.3% | 194% | 14.1 | 10.2 | 1.03 | -33.9% | -47.3% |
| NTB NYSE Bank of N.T. Butterfield |
2.29B | 11.5% | 64.8% | 90.2% | 10.2 | - | 1.96 | -17.4% | -44.9% |
| HBC1 XETRA HSBC Holdings |
293B | 6.92% | 89.3% | 311% | 14.1 | 10.2 | 1.14 | 7.50% | 17.9% |
| BAP NYSE Credicorp |
26.8B | 2.39% | 114% | 172% | 13.7 | 12.6 | 4.55 | -73.5% | -49.2% |
| CIB NYSE Grupo Cibest S.A. |
18.8B | 8.10% | 111% | 311% | 9.26 | 8.51 | 0.43 | 38.8% | -2.15% |
| BBVA MC Banco Bilbao Vizcaya |
124B | 5.95% | 80.4% | 472% | 10.7 | 9.90 | 1.87 | 90.5% | 16.1% |
Compare LYG vs S&P 500
Total Return vs S&P 500
| PERIOD | LYG | S&P 500 |
|---|---|---|
| 1 Week | 7.34% | 3.12% |
| 1 Month | 4.74% | 0.61% |
| 3 Months | 2.83% | -1.99% |
| 6 Months | 27.25% | 4.64% |
| 12 Months | 64.30% | 31.01% |
| 5 Years | 194.16% | 76.73% |
FAQ
Does LYG outperform the market?
Yes, LYG significantly outperforms the market. Over the past 12 months, LYG returned 64.30% compared to 31.01% for the S&P 500.
What is the LYG return over the last 12 months?
LYG has returned 64.30% over the past 12 months, including dividends. Over 3 months the return was 2.83%, and over 5 years 194.16%.
How risky is LYG?
LYG has relatively low risk with a maximum drawdown of 22.72% over the past 3 years. The average drawdown is 6.14%.
LYG vs Sectors (12m)
Relative Performance vs S&P Sectors
Sorted by outperformance, Positive = LYG beats sector.
| SECTOR | ETF | DIFFERENCE 12M |
|---|---|---|
| Consumer Staples | XLP | 57.6% |
| Health Care | XLV | 53.1% |
| Financials | XLF | 52% |
| Real Estate | XLRE | 48.9% |
| Consumer Discretionary | XLY | 43.2% |
| Communication Services | XLC | 36.8% |
| Communication Services | XLC | 36.8% |
| Materials | XLB | 28.8% |
| Industrials | XLI | 23.5% |
| Technology | XLK | 16.7% |
| Energy | XLE | 11.6% |
LYG vs Asset Classes (12m)
Relative Performance vs Major Asset Classes
| ASSET CLASS | ETF | DIFFERENCE 12M |
|---|---|---|
| S&P 500 | SPY | 33.3% |
| Emerging Market | EEM | 11.1% |
| Gold | GLD | 14.8% |
| Long-Term Bonds | TLT | 59.7% |
| Risk-Free Cash | SHY | 60.7% |