(MFH) Mercurity Fintech - Performance 376.3% in 12m
Compare MFH with Indices, Sectors and Commodities and Bonds. Who performs better in which timeframe?
Performance Rating
38.16%
#32 in Group
Rel. Strength
99.58%
#35 in Universe
Total Return 12m
376.26%
#3 in Group
Total Return 5y
341.36%
#9 in Group
P/E -
(?) Percentile in Group
P/E Forward -
(?) Percentile in Group
PEG -
(?) Percentile in Group
FCF Yield -1.74%
(?) Percentile in Group
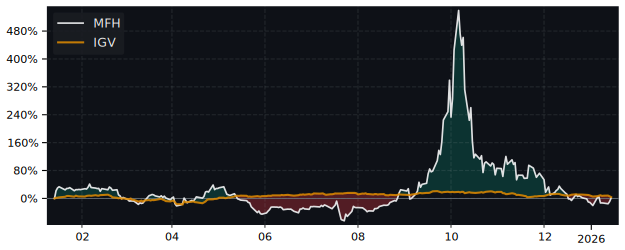
12m Total Return: MFH (376.3%) vs XLK (6.2%)
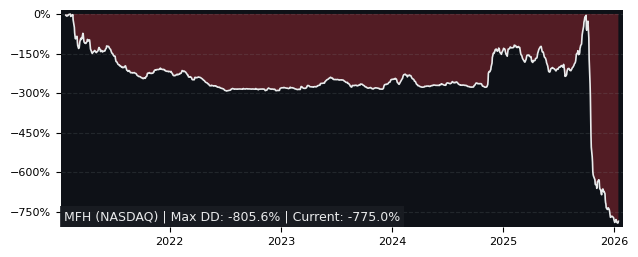
5y Drawdown (Underwater) Chart
Top Performers in Application Software
Overall best picks of Peer Group Selected by proven GARP Predictive Metrics, sorted by Growth Rating
| Symbol | 1m | 12m | 5y | P/E | P/E Forward | PEG | EPS Stability |
EPS CAGR |
|---|---|---|---|---|---|---|---|---|
| CSU TO Constellation Software |
3.92% | 33.8% | 265% | 97.1 | 35 | 1.21 | 49.3% | 2.62% |
| FICO NYSE Fair Isaac |
1.7% | 63.6% | 530% | 86.2 | 63.7 | 1.79 | 72.6% | 27.4% |
| SAP XETRA SAP SE |
-5.43% | 45.6% | 148% | 85.6 | 36.2 | 1.67 | 5.90% | 11.5% |
| SAP NYSE SAP SE |
-0.81% | 52.1% | 160% | 90.9 | 38.8 | 1.78 | 11.2% | 11.5% |
| PTC NASDAQ PTC |
-5.39% | -14.4% | 132% | 44.3 | 24.7 | 1.52 | 3.20% | -7.28% |
| APP NASDAQ Applovin |
-20.1% | 300% | 325% | 52.6 | 42.9 | 1.83 | 78.5% | 178% |
| INTU NASDAQ Intuit |
1.05% | 0.28% | 137% | 55 | 27 | 1.76 | 34.1% | -14% |
| CRM NYSE Salesforce.com |
-7.05% | -1.36% | 71.1% | 38.9 | 22.2 | 1.11 | 89.1% | 23.1% |
Performance Comparison: MFH vs XLK vs S&P 500
XLK (Technology Sector SPDR ETF) is the Sector Benchmark for MFH
| Total Return (including Dividends) | MFH | XLK | S&P 500 |
|---|---|---|---|
| 1 Month | 9.97% | -4.52% | -4.31% |
| 3 Months | -3.07% | -8.23% | -7.85% |
| 12 Months | 376.26% | 6.24% | 10.76% |
| 5 Years | 341.36% | 143.18% | 106.31% |
| Trend Score (consistency of price movement) | MFH | XLK | S&P 500 |
| 1 Month | 36.8% | -28.3% | -35.6% |
| 3 Months | -60.3% | -88.8% | -89.7% |
| 12 Months | 70.0% | 20.2% | 58.3% |
| 5 Years | -23.3% | 86.2% | 84.2% |
| Relative Strength (compared with Indexes) | Rank in Peer Group | vs. XLK | vs. S&P 500 |
| 1 Month | #20 | 15.2% | 14.9% |
| 3 Month | #49 | 5.62% | 5.19% |
| 12 Month | #4 | 348% | 330% |
| 5 Years | #11 | 81.5% | 114% |
FAQs
Does MFH Mercurity Fintech outperforms the market?
Yes,
over the last 12 months MFH made 376.26%, while its related Sector, the Technology Sector SPDR (XLK) made 6.24%.
Over the last 3 months MFH made -3.07%, while XLK made -8.23%.
Over the last 3 months MFH made -3.07%, while XLK made -8.23%.
Performance Comparison MFH vs Indeces and Sectors
MFH vs. Indices MFH is Over or Underperforming
| Symbol | 1w | 1m | 6m | 12m | |
|---|---|---|---|---|---|
| US S&P 500 | SPY | 10.0% | 14.3% | 434% | 366% |
| US NASDAQ 100 | QQQ | 8.06% | 14.2% | 434% | 364% |
| US Dow Jones Industrial 30 | DIA | 12.1% | 15.8% | 434% | 369% |
| German DAX 40 | DAX | 12.7% | 13.8% | 415% | 353% |
| Shanghai Shenzhen CSI 300 | CSI 300 | 16.6% | 13.5% | 435% | 368% |
| Hongkong Hang Seng | HSI | 12.3% | 12.9% | 432% | 362% |
| India NIFTY 50 | INDA | 17.5% | 8.41% | 432% | 374% |
| Brasil Bovespa | EWZ | 10.3% | 8.0% | 429% | 382% |
MFH vs. Sectors MFH is Over or Underperforming
| Symbol | 1w | 1m | 6m | 12m | |
|---|---|---|---|---|---|
| Communication Services | XLC | 10.2% | 15.6% | 425% | 354% |
| Consumer Discretionary | XLY | 7.67% | 14.0% | 431% | 362% |
| Consumer Staples | XLP | 17.5% | 7.22% | 429% | 367% |
| Energy | XLE | 13.4% | 21.6% | 436% | 388% |
| Financial | XLF | 12.0% | 14.8% | 426% | 357% |
| Health Care | XLV | 13.0% | 14.9% | 436% | 376% |
| Industrial | XLI | 11.9% | 14.0% | 434% | 369% |
| Materials | XLB | 13.3% | 14.5% | 441% | 382% |
| Real Estate | XLRE | 14.9% | 11.9% | 436% | 361% |
| Technology | XLK | 6.21% | 14.5% | 439% | 370% |
| Utilities | XLU | 14.2% | 8.29% | 431% | 356% |
| Aerospace & Defense | XAR | 10.5% | 10.3% | 423% | 349% |
| Biotech | XBI | 10.9% | 17.8% | 447% | 379% |
| Homebuilder | XHB | 11.8% | 16.0% | 449% | 384% |
| Retail | XRT | 12.8% | 12.9% | 438% | 380% |