OMF Performance: 40.3% Return (12 Months)
OMF returned 40.3% over 12 months, outperforming the S&P 500 (31.0%). Volatility: 32.3%.
RS IBD
1.70
Top 42% in Peers
Volatility
32.3%
Top 21% in Peers
Total Return 12m
40.32%
Top 32% in Peers
RS Rating
41.24
Top 42% in Peers
P/E
| P/E Trailing | 8.63 |
| P/E Forward | 7.84 |
High / Low 52w
| 52 Week High | 70.05 USD |
| 52 Week Low | 39.88 USD |
Sentiment
| VRO Trend Strength ±100 | 55.62 |
| Buy Signal ±3 | -0.29 |
Drawdowns 3y
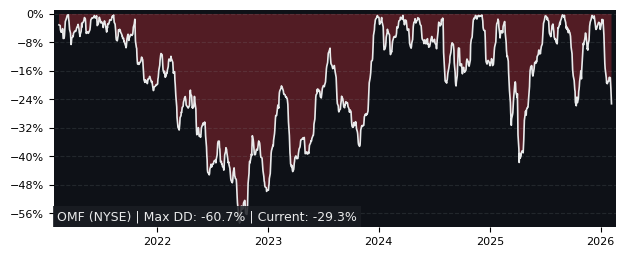
| Max Drawdown | 29.94% |
| Mean Drawdown | 7.74% |
Compare vs 30 peers in Consumer Finance
12m Total Return: OMF (40.3%) vs PEER ETF
5y Drawdown (Underwater) Chart
Top Performer in Consumer Finance (5/30)
Short Term Performance
| SYMBOL | 1W | 1M | 3M |
|---|---|---|---|
| ECPG | 4.00% | 11.22% | 36.16% |
| EZPW | 7.94% | 8.67% | 30.94% |
| FCFS | 5.90% | 3.41% | 21.65% |
| PRAA | 5.99% | 4.37% | 14.49% |
| BFH | 5.07% | 8.80% | 10.35% |
| OMF | 1.80% | 3.71% | -14.38% |
Long Term Performance
| SYMBOL | 6M | 12M | 5Y |
|---|---|---|---|
| ECPG | 79.68% | 156.39% | 93.41% |
| EZPW | 55.16% | 85.22% | 436.26% |
| BFH | 47.00% | 80.49% | 21.43% |
| FCFS | 34.45% | 70.77% | 216.10% |
| ENVA | 39.36% | 59.78% | 322.35% |
| OMF | 11.26% | 40.32% | 58.82% |
Overall Best Picks of Peer Group (GARP Metrics)
| SYMBOL | MCAP | 1M | 12M | 5Y | P/E | P/E fwd | PEG | EPS stab | EPS cagr |
|---|---|---|---|---|---|---|---|---|---|
| ECPG NASDAQ Encore Capital |
1.65B | 11.2% | 156% | 93.4% | 6.76 | 4.04 | 0.17 | 18.5% | -10.6% |
| JCAP NASDAQ Jefferson Capital, Common |
1.08B | -3.48% | 11.9% | 11.9% | 3.45 | - | - | -96.5% | -36.5% |
| LC NYSE LendingClub |
1.65B | 1.44% | 60.2% | -1.27% | 12.3 | 7.96 | -18.1 | -13.8% | -61.4% |
Compare OMF vs S&P 500
Total Return vs S&P 500
| PERIOD | OMF | S&P 500 |
|---|---|---|
| 1 Week | 1.80% | 3.12% |
| 1 Month | 3.71% | 0.61% |
| 3 Months | -14.38% | -1.99% |
| 6 Months | 11.26% | 4.64% |
| 12 Months | 40.32% | 31.01% |
| 5 Years | 58.82% | 76.73% |
FAQ
Does OMF outperform the market?
Yes, OMF significantly outperforms the market. Over the past 12 months, OMF returned 40.32% compared to 31.01% for the S&P 500.
What is the OMF return over the last 12 months?
OMF has returned 40.32% over the past 12 months, including dividends. Over 3 months the return was -14.38%, and over 5 years 58.82%.
How risky is OMF?
OMF has relatively low risk with a maximum drawdown of 29.94% over the past 3 years. The average drawdown is 7.74%.
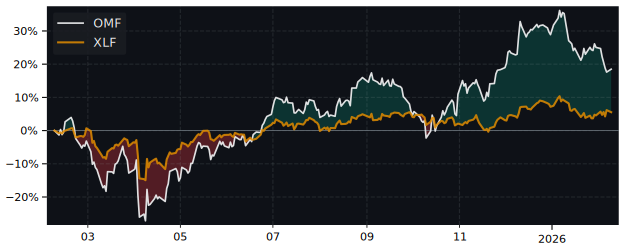
OMF vs Sectors (12m)
Relative Performance vs S&P Sectors
Sorted by outperformance, Positive = OMF beats sector.
| SECTOR | ETF | DIFFERENCE 12M |
|---|---|---|
| Consumer Staples | XLP | 33.6% |
| Health Care | XLV | 29.2% |
| Financials | XLF | 28% |
| Real Estate | XLRE | 24.9% |
| Consumer Discretionary | XLY | 19.2% |
| Communication Services | XLC | 12.9% |
| Communication Services | XLC | 12.9% |
| Materials | XLB | 4.8% |
| Industrials | XLI | -0.5% |
| Technology | XLK | -7.3% |
| Energy | XLE | -12.4% |
OMF vs Asset Classes (12m)
Relative Performance vs Major Asset Classes
| ASSET CLASS | ETF | DIFFERENCE 12M |
|---|---|---|
| S&P 500 | SPY | 9.3% |
| Emerging Market | EEM | -12.9% |
| Gold | GLD | -9.2% |
| Long-Term Bonds | TLT | 35.7% |
| Risk-Free Cash | SHY | 36.8% |