(ALTBG) Blockchain - Performance 710% in 12m
Compare ALTBG with Indices, Sectors and Commodities and Bonds. Who performs better in which timeframe?
Performance Rating
27.57%
#46 in Group
Rel. Strength
99.85%
#13 in Universe
Total Return 12m
710.00%
#2 in Group
Total Return 5y
252.79%
#16 in Group
P/E -
(?) Percentile in Group
P/E Forward -
(?) Percentile in Group
PEG -
(?) Percentile in Group
FCF Yield 0.66%
33th Percentile in Group
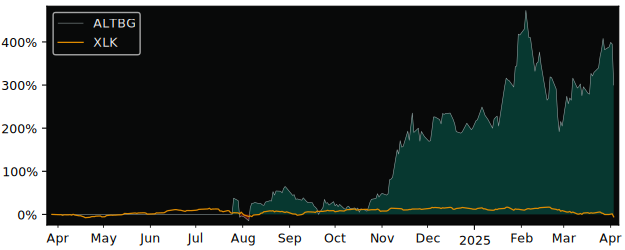
12m Total Return: ALTBG (710%) vs XLK (6.2%)
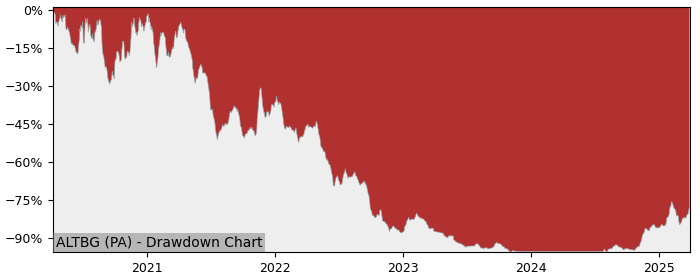
5y Drawdown (Underwater) Chart
Top Performers in Application Software
Overall best picks of Peer Group Selected by proven GARP Predictive Metrics, sorted by Growth Rating
| Symbol | 1m | 12m | 5y | P/E | P/E Forward | PEG | EPS Stability |
EPS CAGR |
|---|---|---|---|---|---|---|---|---|
| CSU TO Constellation Software |
3.92% | 33.8% | 265% | 97.1 | 35 | 1.21 | 49.3% | 2.62% |
| FICO NYSE Fair Isaac |
1.7% | 63.6% | 530% | 86.2 | 63.7 | 1.79 | 72.6% | 27.4% |
| SAP XETRA SAP SE |
-5.43% | 45.6% | 148% | 85.6 | 36.2 | 1.67 | 5.90% | 11.5% |
| SAP NYSE SAP SE |
-0.81% | 52.1% | 160% | 90.9 | 38.8 | 1.78 | 11.2% | 11.5% |
| PTC NASDAQ PTC |
-5.39% | -14.4% | 132% | 44.3 | 24.7 | 1.52 | 3.20% | -7.28% |
| APP NASDAQ Applovin |
-20.1% | 300% | 325% | 52.6 | 42.9 | 1.83 | 78.5% | 178% |
| INTU NASDAQ Intuit |
1.05% | 0.28% | 137% | 55 | 27 | 1.76 | 34.1% | -14% |
| CRM NYSE Salesforce.com |
-7.05% | -1.36% | 71.1% | 38.9 | 22.2 | 1.11 | 89.1% | 23.1% |
Performance Comparison: ALTBG vs XLK vs S&P 500
XLK (Technology Sector SPDR ETF) is the Sector Benchmark for ALTBG
| Total Return (including Dividends) | ALTBG | XLK | S&P 500 |
|---|---|---|---|
| 1 Month | 73.82% | -4.52% | -4.31% |
| 3 Months | 104.80% | -8.23% | -7.85% |
| 12 Months | 710.00% | 6.24% | 10.76% |
| 5 Years | 252.79% | 143.18% | 106.31% |
| Trend Score (consistency of price movement) | ALTBG | XLK | S&P 500 |
| 1 Month | 73.4% | -28.3% | -35.6% |
| 3 Months | 29.4% | -88.8% | -89.7% |
| 12 Months | 94.0% | 20.2% | 58.3% |
| 5 Years | -70.5% | 86.2% | 84.2% |
| Relative Strength (compared with Indexes) | Rank in Peer Group | vs. XLK | vs. S&P 500 |
| 1 Month | #2 | 82.1% | 81.7% |
| 3 Month | #4 | 123% | 122% |
| 12 Month | #3 | 662% | 631% |
| 5 Years | #19 | 45.1% | 71.0% |
FAQs
Does ALTBG Blockchain outperforms the market?
Yes,
over the last 12 months ALTBG made 710.00%, while its related Sector, the Technology Sector SPDR (XLK) made 6.24%.
Over the last 3 months ALTBG made 104.80%, while XLK made -8.23%.
Over the last 3 months ALTBG made 104.80%, while XLK made -8.23%.
Performance Comparison ALTBG vs Indeces and Sectors
ALTBG vs. Indices ALTBG is Over or Underperforming
| Symbol | 1w | 1m | 6m | 12m | |
|---|---|---|---|---|---|
| US S&P 500 | SPY | 19.0% | 78.1% | 504% | 699% |
| US NASDAQ 100 | QQQ | 17.1% | 78.1% | 504% | 698% |
| US Dow Jones Industrial 30 | DIA | 21.1% | 79.6% | 504% | 703% |
| German DAX 40 | DAX | 21.7% | 77.6% | 486% | 686% |
| Shanghai Shenzhen CSI 300 | CSI 300 | 25.6% | 77.3% | 506% | 701% |
| Hongkong Hang Seng | HSI | 21.3% | 76.7% | 502% | 696% |
| India NIFTY 50 | INDA | 26.5% | 72.3% | 503% | 708% |
| Brasil Bovespa | EWZ | 19.3% | 71.9% | 500% | 716% |
ALTBG vs. Sectors ALTBG is Over or Underperforming
| Symbol | 1w | 1m | 6m | 12m | |
|---|---|---|---|---|---|
| Communication Services | XLC | 19.2% | 79.4% | 496% | 688% |
| Consumer Discretionary | XLY | 16.7% | 77.9% | 501% | 696% |
| Consumer Staples | XLP | 26.5% | 71.1% | 499% | 701% |
| Energy | XLE | 22.4% | 85.5% | 507% | 722% |
| Financial | XLF | 21.0% | 78.6% | 496% | 691% |
| Health Care | XLV | 22.0% | 78.8% | 506% | 710% |
| Industrial | XLI | 20.9% | 77.9% | 504% | 703% |
| Materials | XLB | 22.3% | 78.3% | 511% | 715% |
| Real Estate | XLRE | 23.9% | 75.7% | 506% | 695% |
| Technology | XLK | 15.2% | 78.3% | 509% | 704% |
| Utilities | XLU | 23.2% | 72.1% | 501% | 690% |
| Aerospace & Defense | XAR | 19.5% | 74.1% | 493% | 683% |
| Biotech | XBI | 19.9% | 81.7% | 517% | 712% |
| Homebuilder | XHB | 20.8% | 79.8% | 519% | 718% |
| Retail | XRT | 21.8% | 76.8% | 508% | 714% |